Lecture 1
Course overview. Introduction to big data concepts. The Cloud.
Agenda for today’s session
Course and syllabus overview
Big Data Concepts
- Definition
- Challenges
- Approaches
Data Engineering
Introduction to
bash- Lab: Linux command line
Bookmark these links!
- Course website: https://gwu-dats6450-13.github.io/6450-spring-2026
- GitHub Organization for your deliverables: https://github.com/gwu-dats6450-13/
- Slack Workspace: DATS 6450.13 Spring 2026 - 6450-spring-2026.slack.com
Instructors
- Abhijit Dasgupta,
abhijit.dasgupta@gwu.edu - TA: Vishal Fulsundar
vishal.fulsundar@gwmail.gwu.edu
Abhijit Dasgupta
“AI” is the new line of makeup in data science; putting it on makes even BS attractive
- Data Science Director at AstraZeneca supporting Oncology R&D (lung, breast, bladder, GI, ovarian)
- biomarkers, clinical studies, strategy, decision-making, education
- Bayesian, survival, visualization, high-dimensional, causality
- Adjunct Professor at Georgetown since 2020, GMU since 2018, GWU since 2026
- Data science consultant in a wide variety of domains, from the USPS to telecom to environmental health and epidemiology
- R and reproducible research evangelist
- Python is cool too!!
Fun facts
- Aikido instructor (5th degree black belt), teaching since 1994
 Community theater actor with Ebong Theatrix (Bengali group in DC)
Course Description
Data is everywhere! Many times, it’s just too big to work with traditional tools. This is a hands-on, practical workshop style course about using cloud computing resources to do analysis and manipulation of datasets that are too large to fit on a single machine and/or analyzed with traditional tools. The course will focus on Spark, MapReduce, the Hadoop Ecosystem and other tools.
You will understand how to acquire and/or ingest the data, and then massage, clean, transform, analyze, and model it within the context of big data analytics. You will be able to think more programmatically and logically about your big data needs, tools and issues.
Always refer to the syllabus in the course website for class policies.
Learning objectives
- Build data pipelines and transformations using DuckDB and PySpark.
- Use concepts of parallelization, embarrasingly parallel problems, and applications in Python to process large data
- Compare computational efficiency, memory management, and scalability between single-node, cluster and distributed frameworks.
- Optimize queries, caching, and partitioning strategies across engines.
- Apply datashader or equivalent tools to visualize large datasets efficiently.
- Develop end-to-end reproducible analytics workflows integrating both systems.
Evaluation
- homework (25%)
- lab completions (10%)
- quizzes (10%)
- midterm exams (15%)
- final group project (30%)
- class participation/attendance (10%)
Course Materials
- Slides/labs/assignment on Website/GitHub
- Quizzes and readings in Blackboard
- No required textbook. Recommended readings will be provided.
Communication
- Slack is the primary form of communication for this course. Please join the Slack workspace for announcements, questions, and discussions.
- Email is reserved for private matters only. Please allow 24-48 hours for a response
- In-person office hours will be held the hour before class in this classroom
- Online office hours are by appointment (at this link)
Slack rules:
- Post any question/comment about the course, assignments or any technical issue.
- DMs are to be used sparingly
- You may not DM multiple people in the instructional team at the same time for the same issue
- Keep an eye on the questions posted in Slack. Use the search function. It’s very possible that we have already answered a questions
- You may DM us back only if we DM you first on a given issue
- Lab/assignment/project questions will only be answered up to 6 hours before something is due
Midterms
We will have 2 midterms during the semester. They will be held during regular class hours. The midterms will be a short coding project that will be based on the previous labs and assignments. No GAI (chatGPT etc) will be allowed for the midterms
Details: TBD (will be announced by week 3)
Final Project
- Groups of 2-3 students
- Use an archive of Reddit data, augmented with external data
- Exploratory analysis
- NLP
- Machine Learning
- Writeup
- Data sourcing and ingesting
- Exploratory analysis
- Modeling
- Challenges and Learnings
- Conclusions
- Future work
- Presentation
- 15 minute presentation
- Demo of code/workflow
- Due date: Finals week (date TBD)
BIG DATA
Where does it come from?
How is it being created?
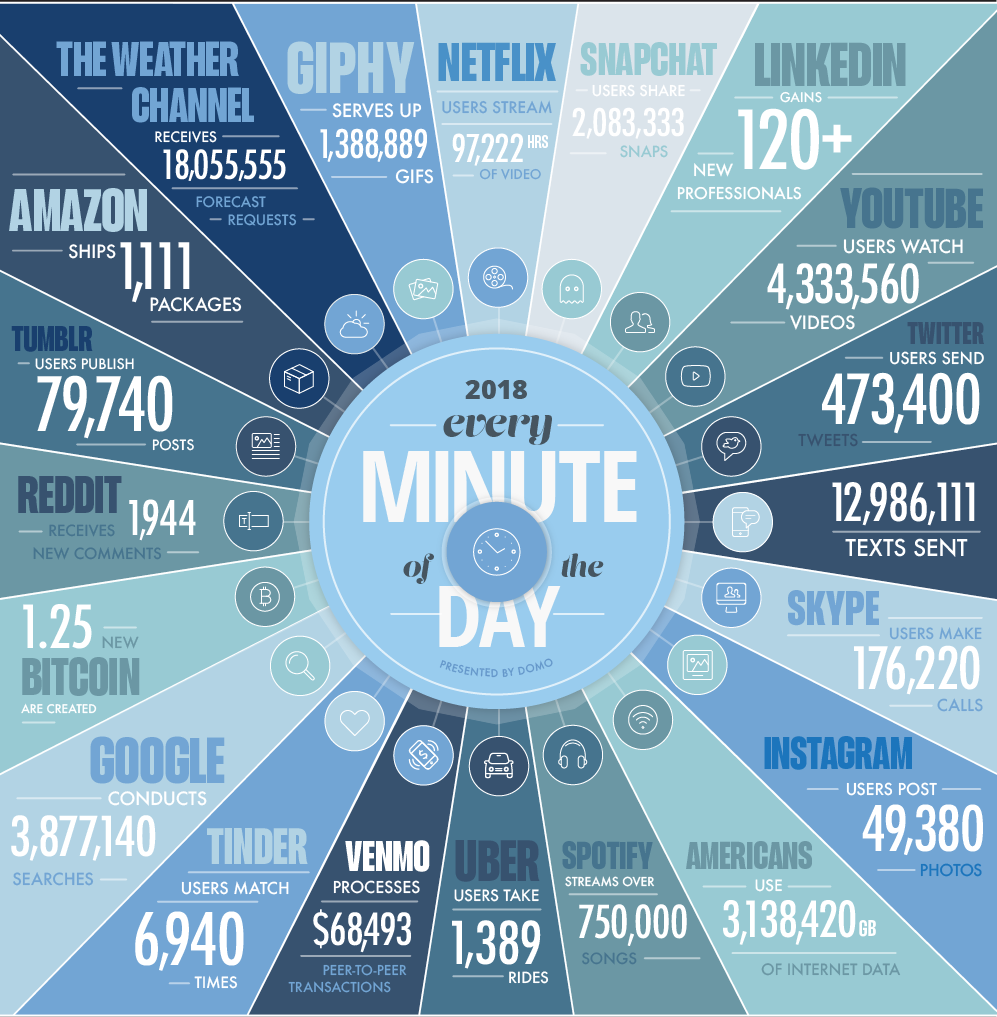
In one minute of time (2018)
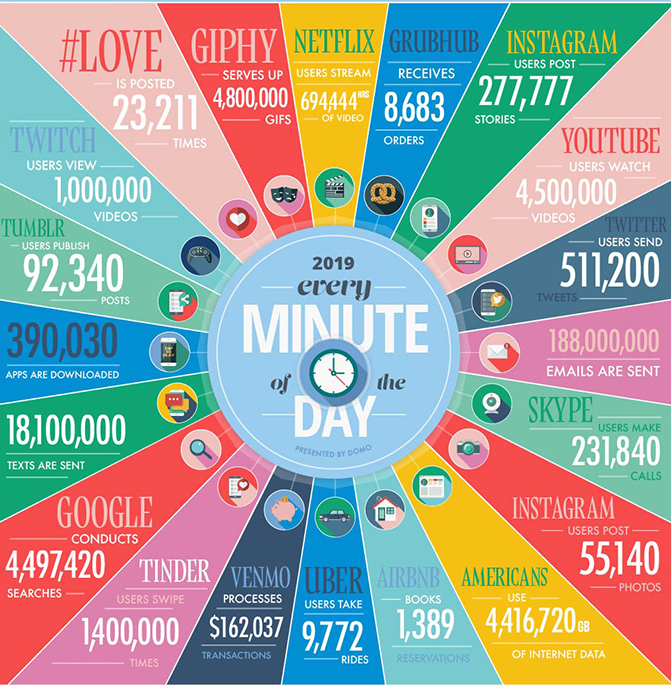
In one minute of time (2019)
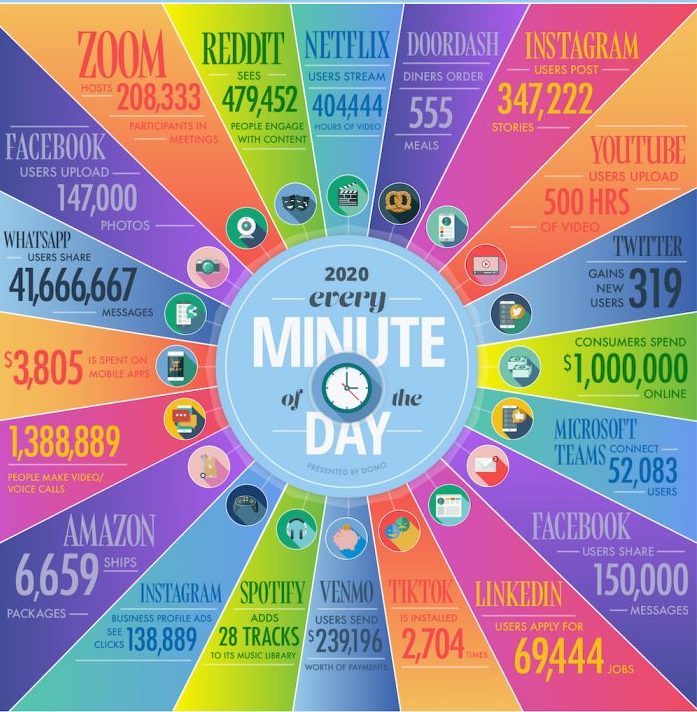
In one minute of time (2020)
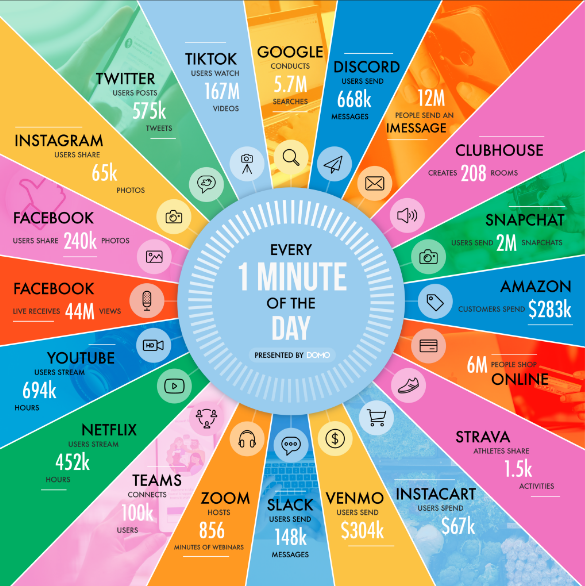
In one minute of time (2021)
In one minute of time (2025)
Every 60 seconds in 2025: * ChatGPT serves millions of requests (exact numbers proprietary) * 500 hours of video uploaded to YouTube * 1.04 million Slack messages sent * 362,000 hours watched on Netflix * 5.9-11.4 million Google searches * $443,000 spent on Amazon * AI-generated images created at massive scale (metrics not publicly available) * 347,200 posts on X (formerly Twitter) * 231-250 million emails sent
A lot of it is hapenning online.
We can record every: * click * ad impression * billing event * video interaction * server request * transaction * network message * fault * …

It can also be user-generated content, e.g.:
- Instagram posts & Reels
- X (Twitter) posts & Threads
- TikTok videos
- YouTube Shorts
- Reddit discussions
- Discord conversations
- AI-generated content (text, images, code)
- …

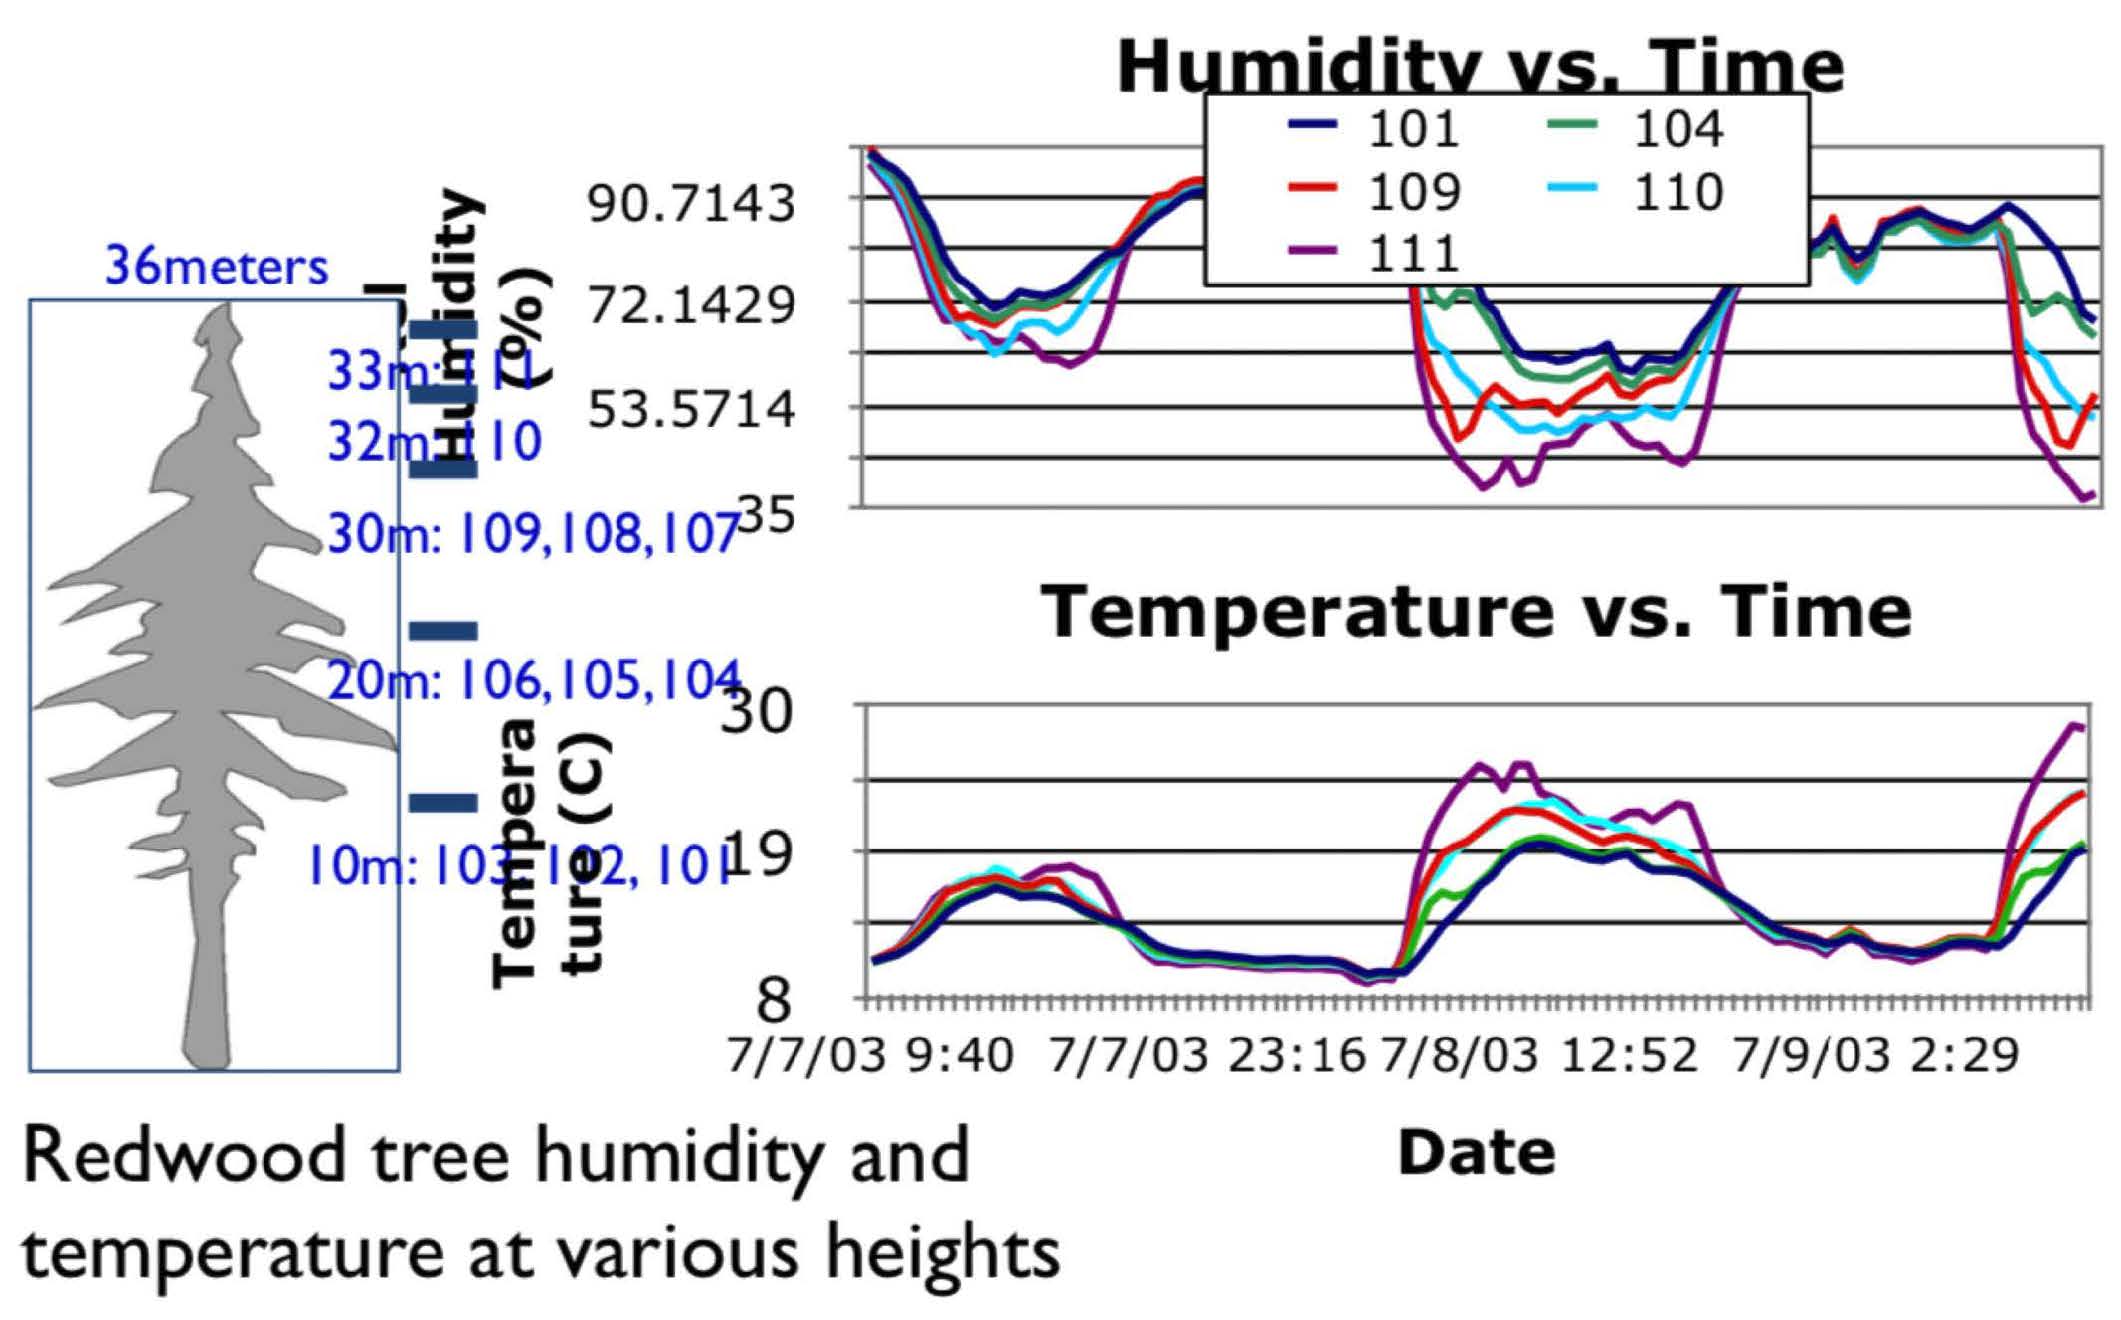
But health and scientific computing create a lot too!
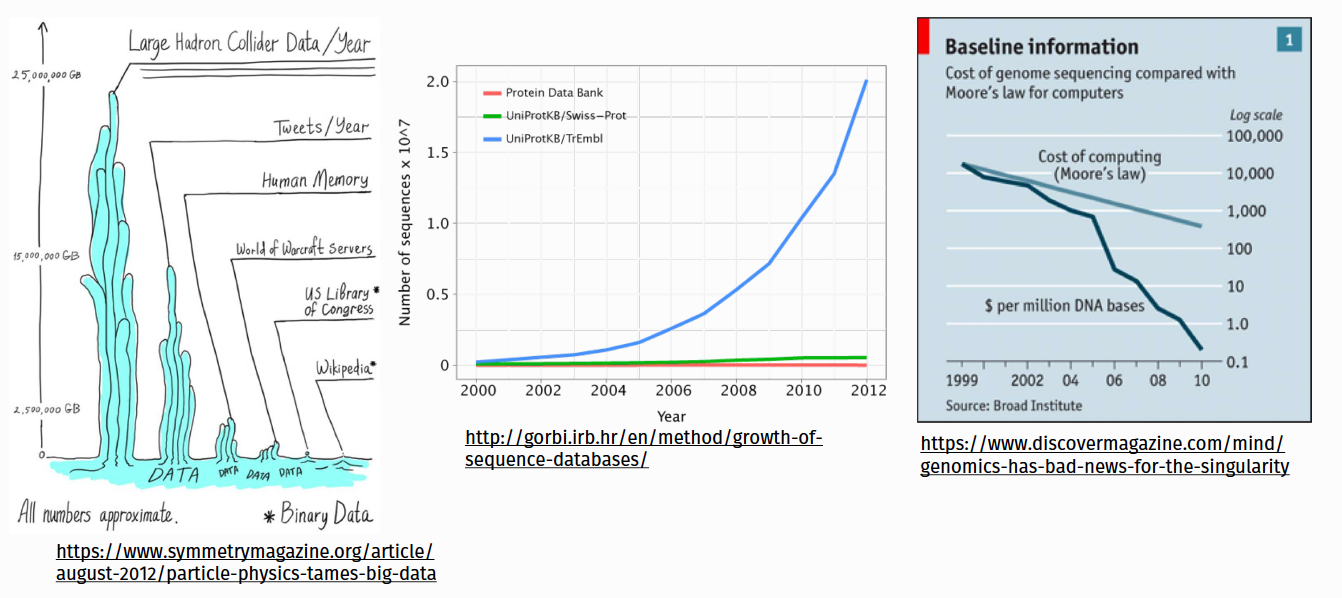
???
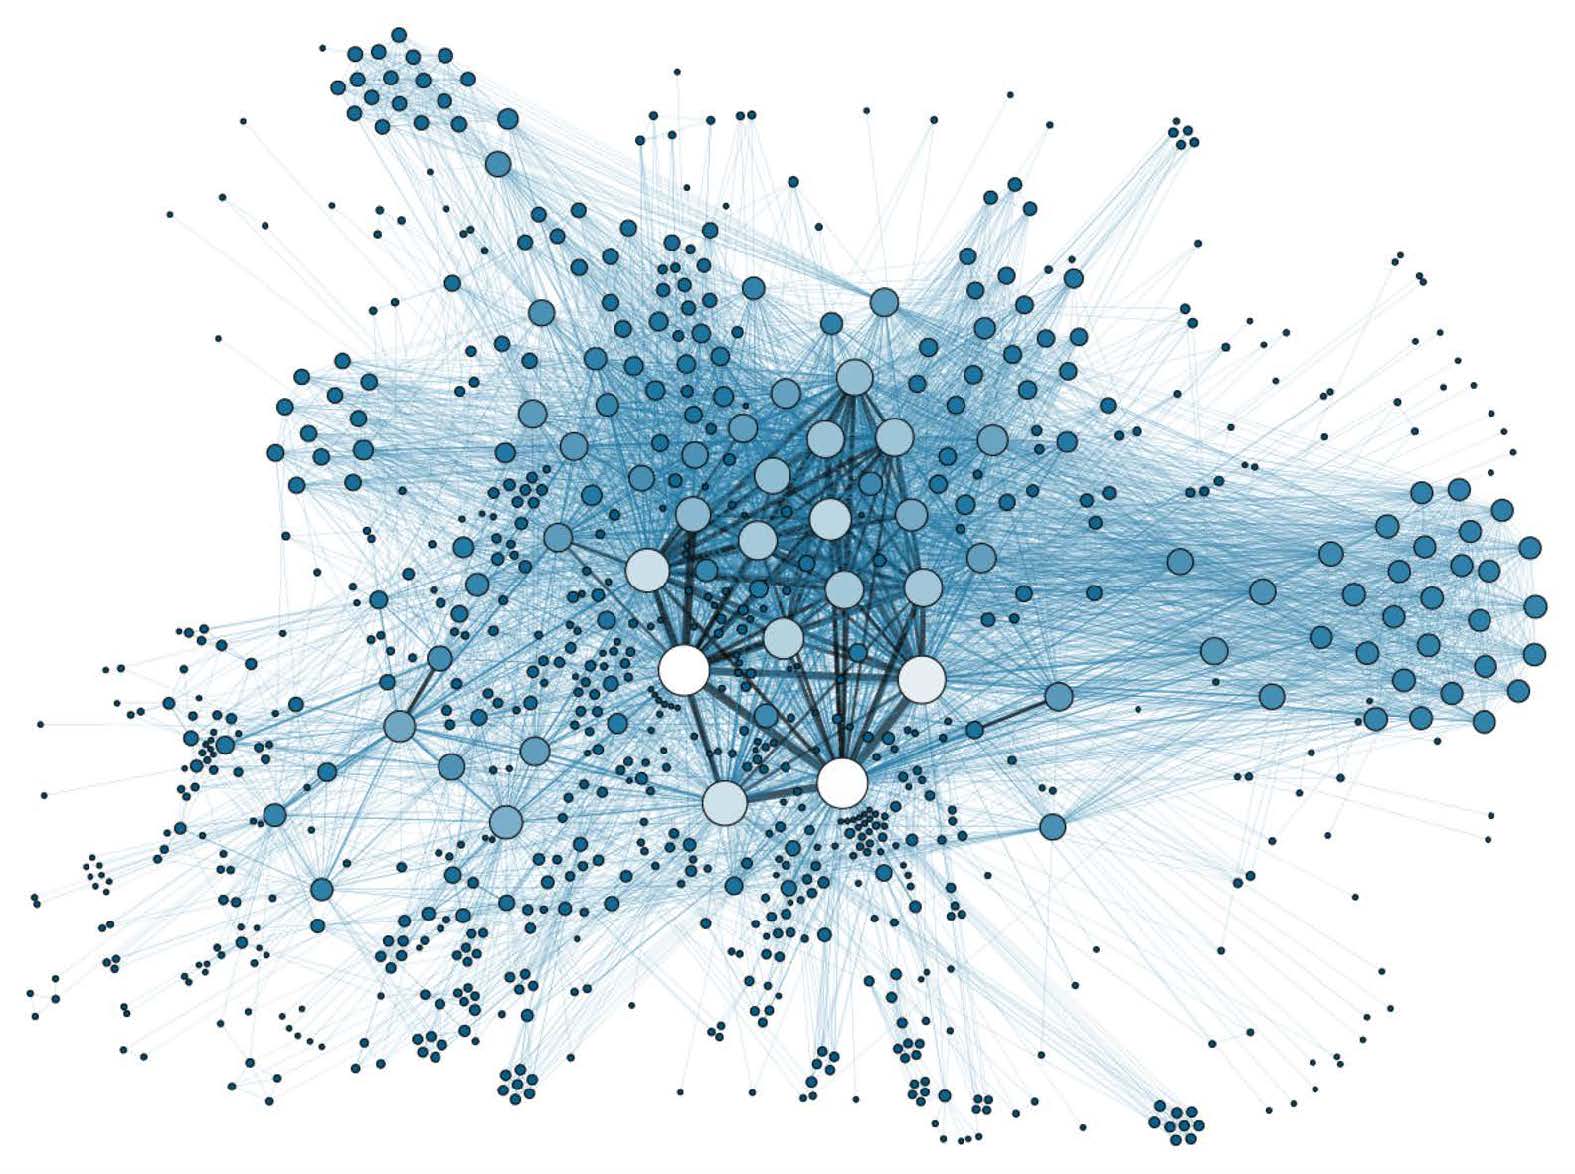
There’s lots of graph data too
Many interesting datasets have a graph structure:
- Social networks
- Google’s knowledge graph
- Telecom networks
- Computer networks
- Road networks
- Collaboration/relationships
Some of these are HUGE
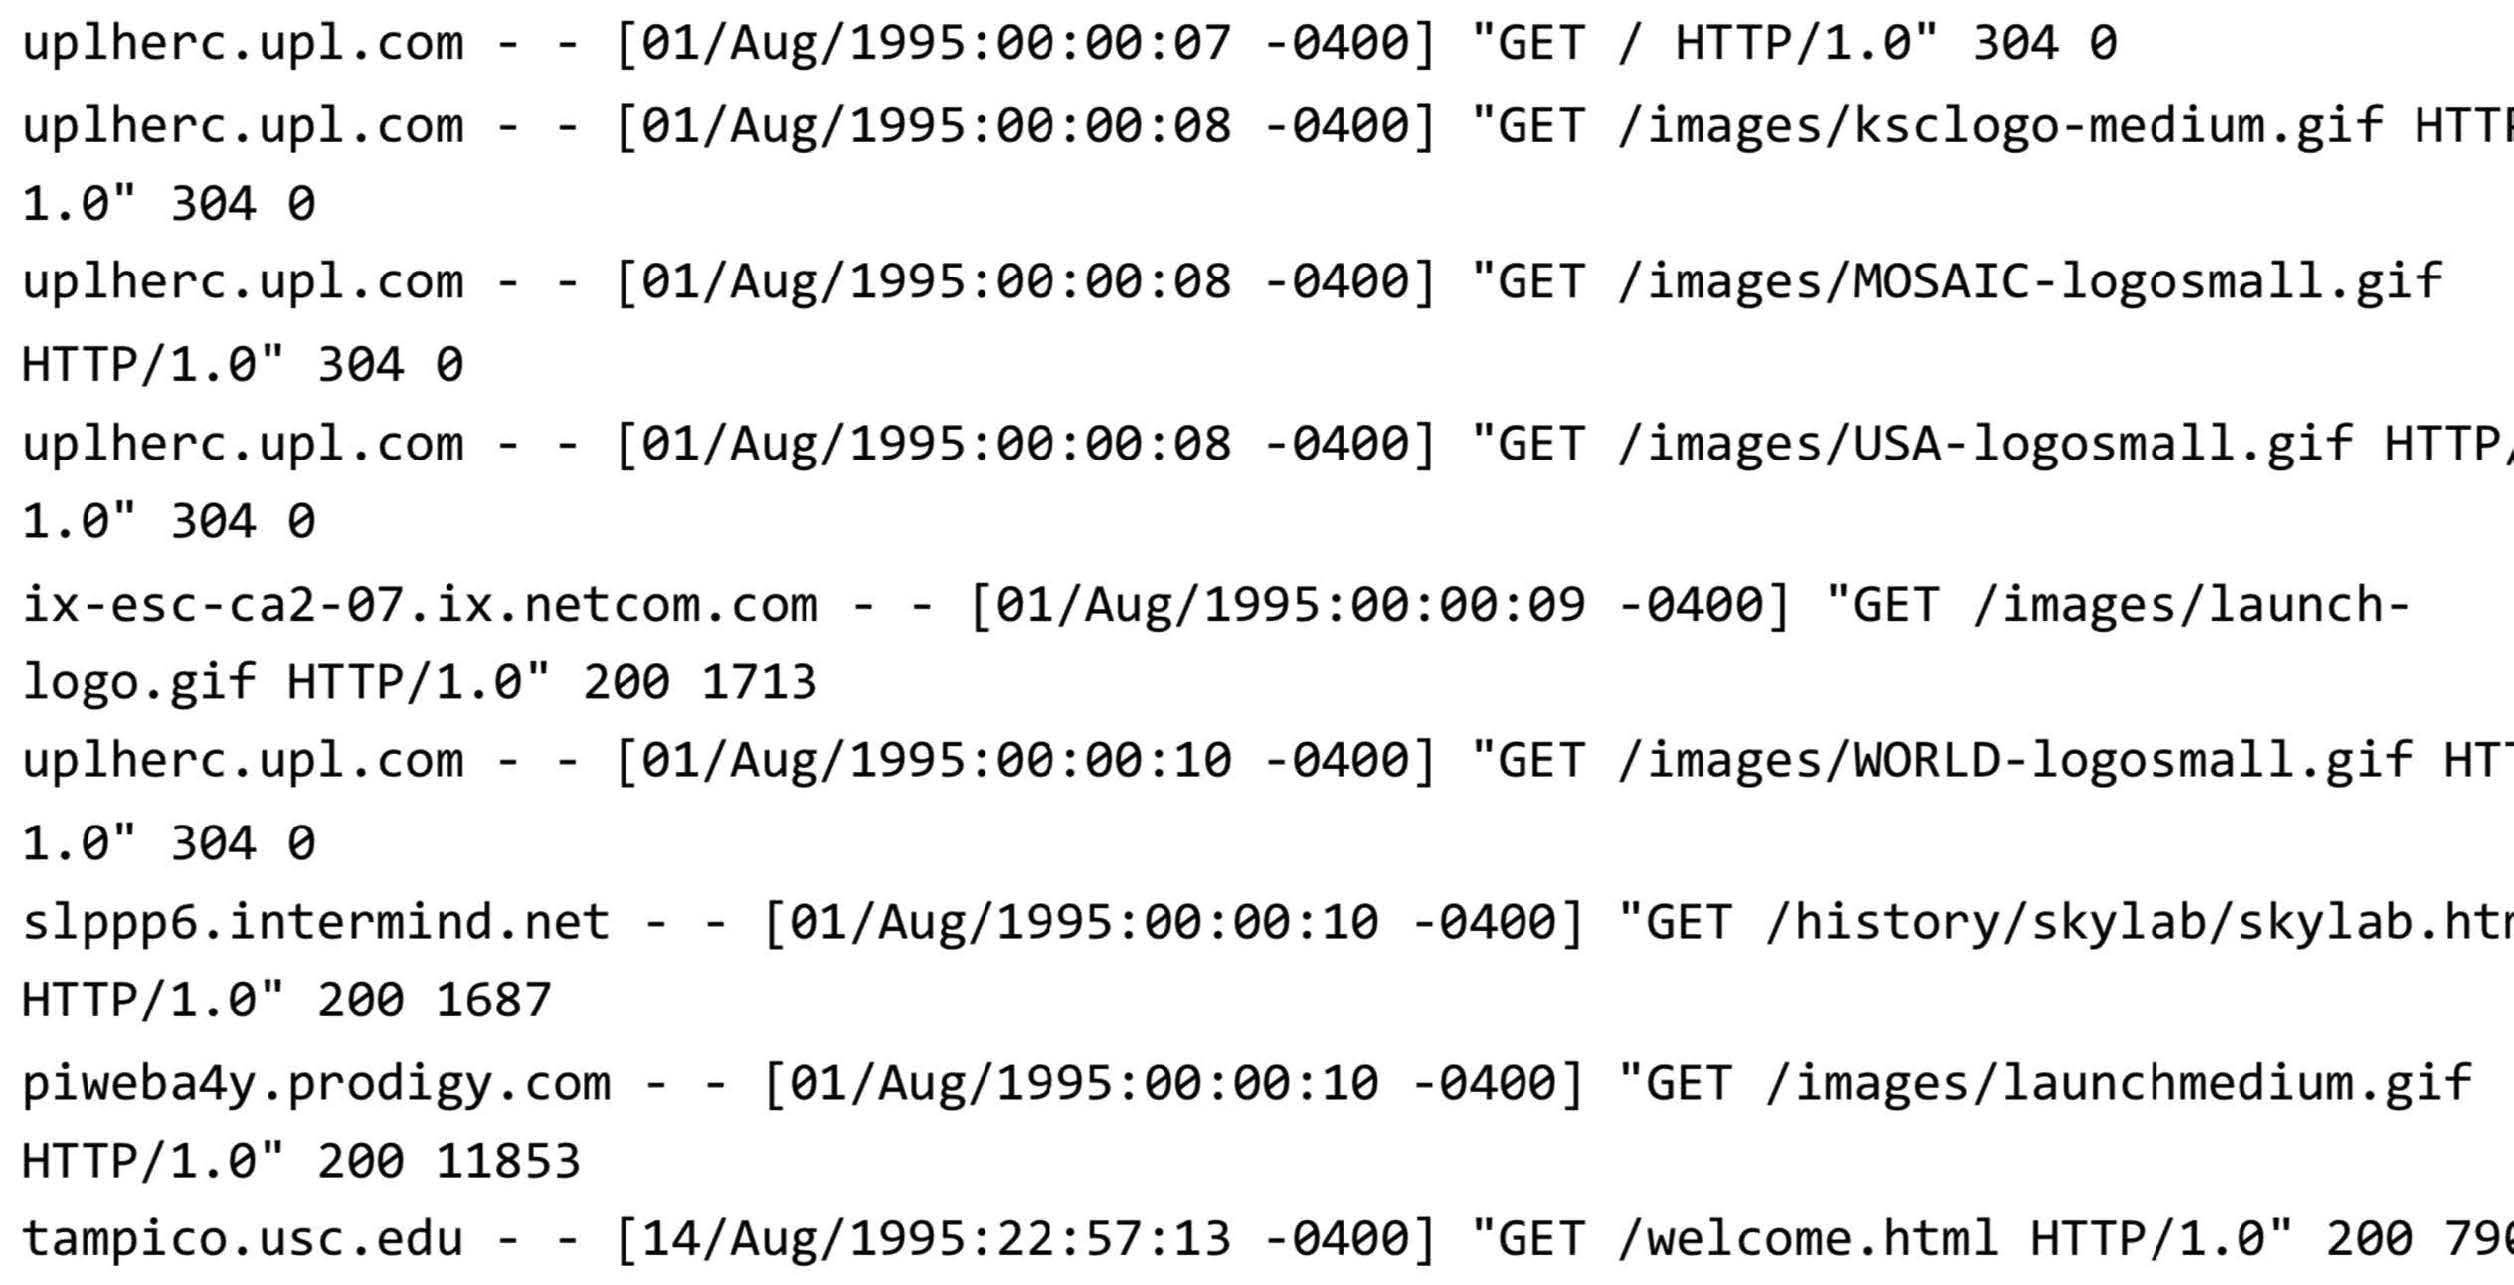
Apache (web server) log files
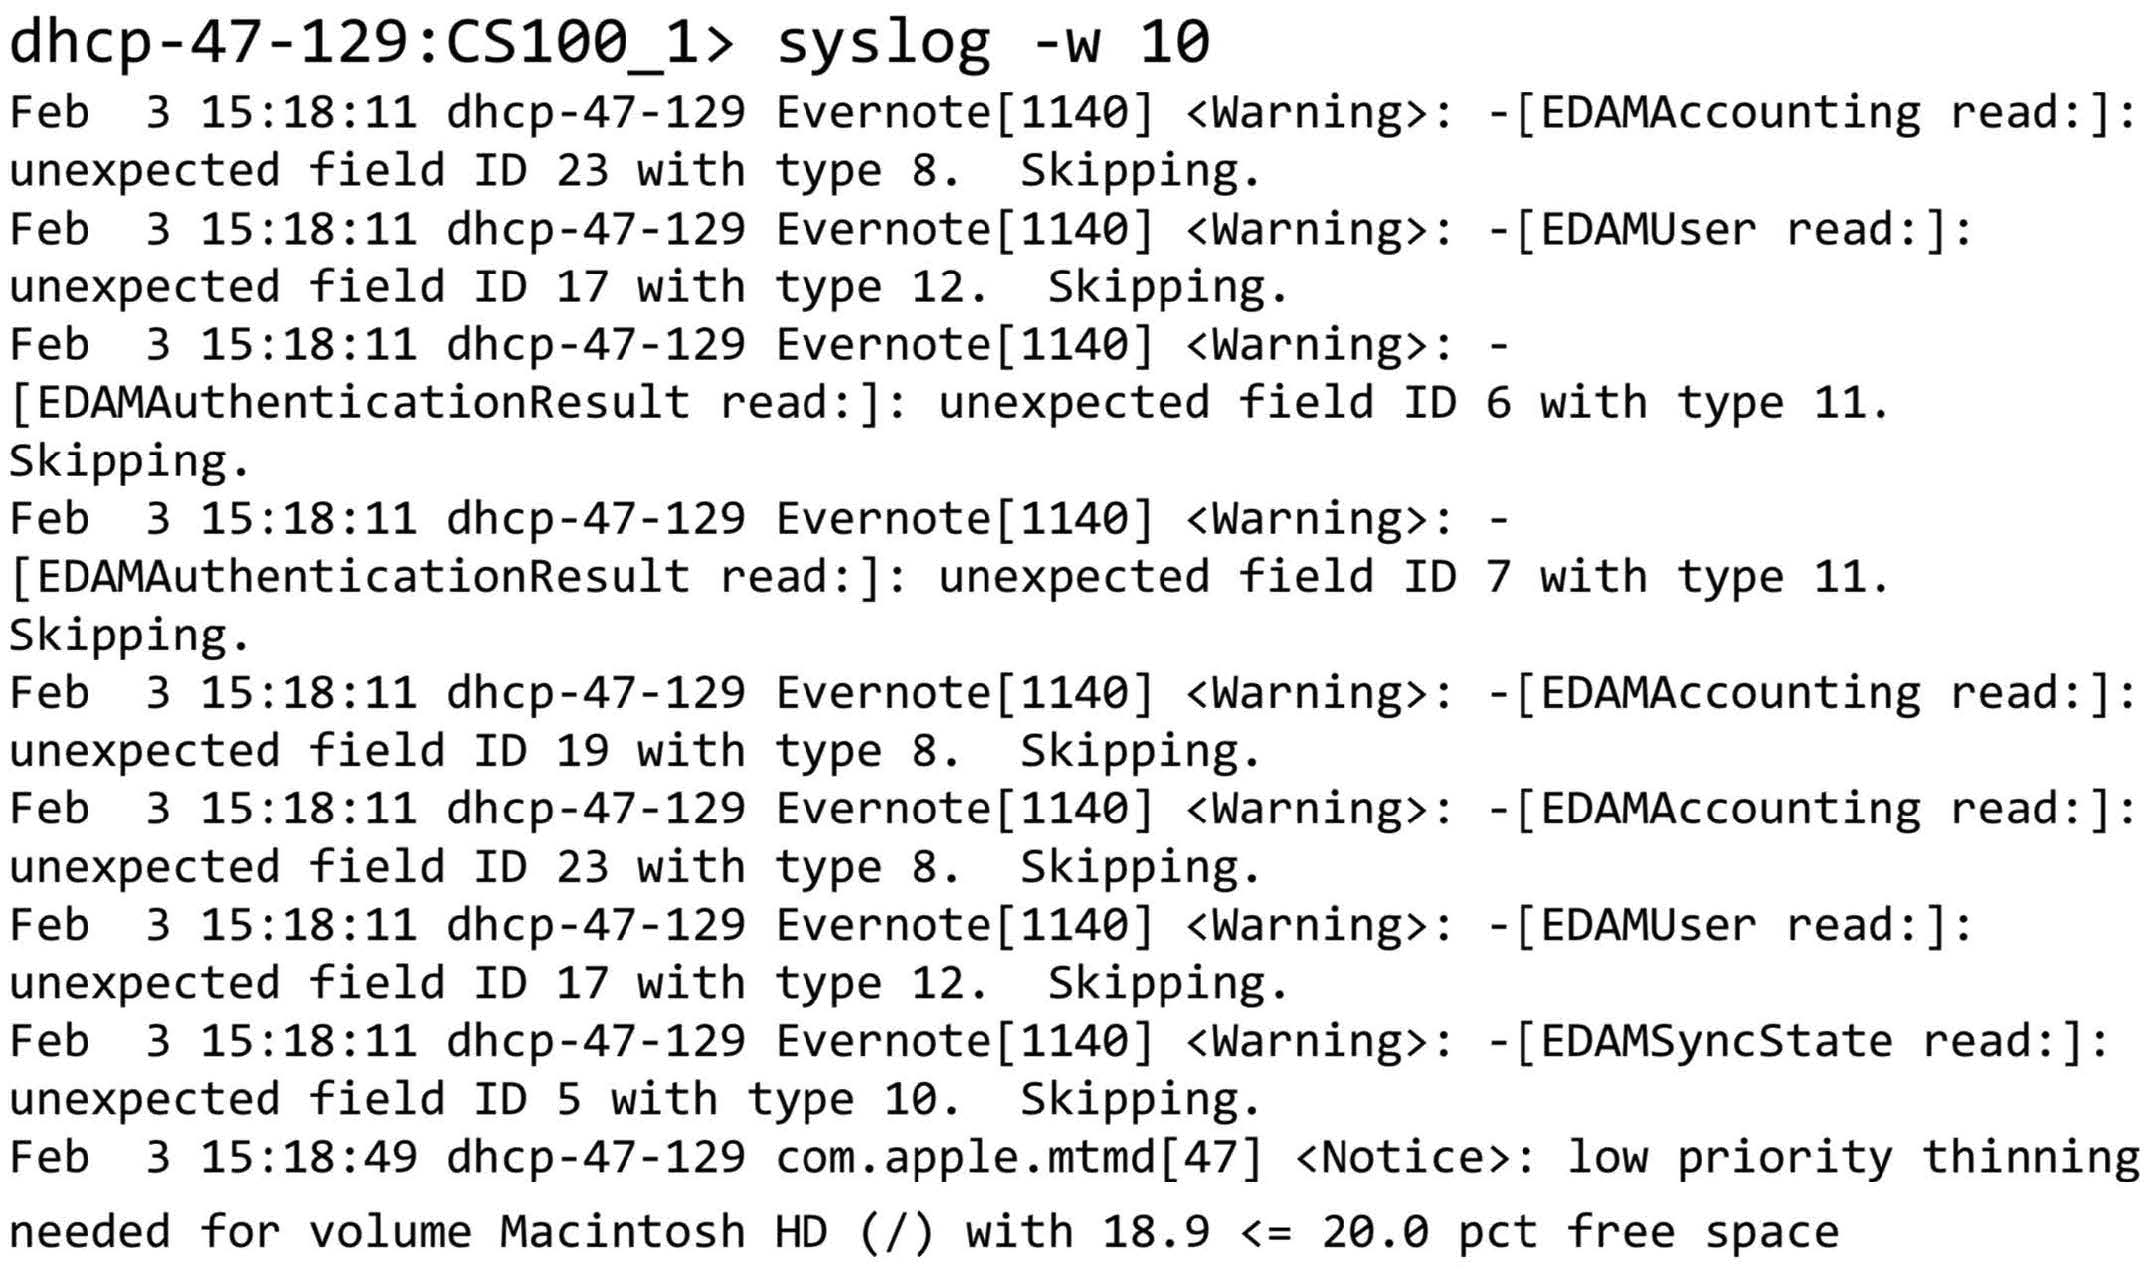
System log files
Internet of Things (IoT) in 2025
75 billion connected devices generating data: * Smart home devices (Alexa, Google Home, Apple HomePod) * Wearables (Apple Watch, Fitbit, Oura rings) * Connected vehicles & autonomous driving systems * Industrial IoT sensors * Smart city infrastructure * Medical devices & remote patient monitoring
Smartphones collecting our information
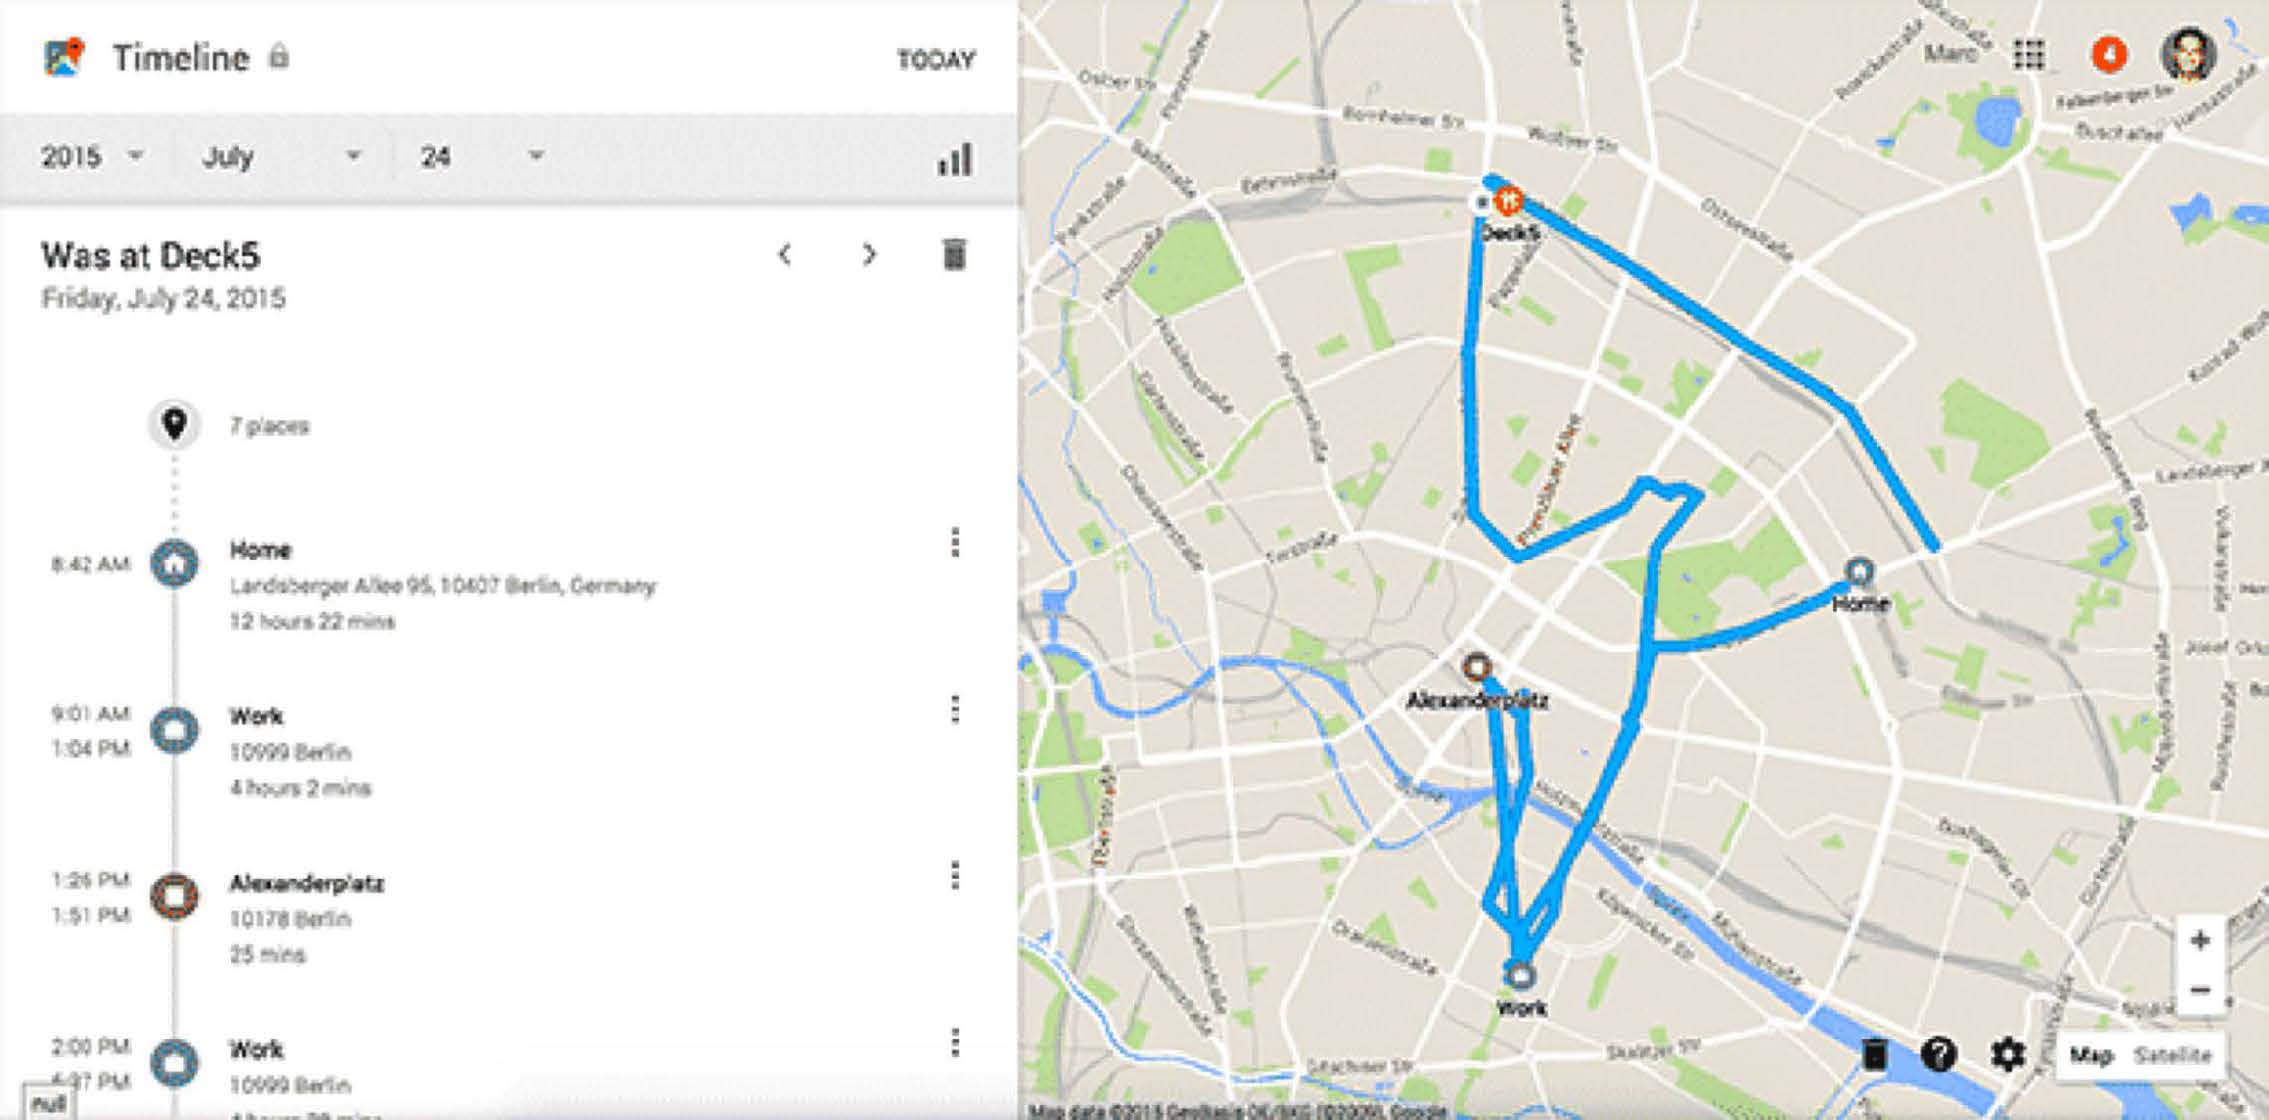
Where else?
The Internet
Transactions
Databases
Excel
PDF Files
Anything digital (music, movies, apps)
Some old floppy disk lying around the house
Typical real world scenarios (2026)
Scenario 1: Traditional Big Data
You have a laptop with 16GB of RAM and a 256GB SSD. You are given a 1TB dataset in text files. What do you do?
Scenario 2: AI/ML Pipeline
Your company wants to build a RAG system using 10TB of internal documents. You need sub-second query response times. How do you architect this?
Scenario 3: Real-time Analytics
You need to process 1 million events per second from IoT devices and provide real-time dashboards with <1 second latency. What’s your stack?
What is Big Data?
Let’s discuss!
Big Data Definitions
Wikipedia
“In essence, is a term for a collection of datasets so large and complex that it becomes difficult to process using traditional tools and applications. Big Data technologies describe a new generation of technologies and architectures designed to economically extract value from very large volumes of a wide variety of data, by enabling high-velocity capture, discover and/or analysis”
O’Reilly
“Big data is when the size of the data itself becomes part of the problem”
EMC/IDC
“Big data technologies describe a new generation of technologies and architectures, designed to economically extract value from very large volumes of a wide variety of data, by enabling high-velocity capture, discovery, and/or analysis.”
Frameworks for thinking about Big Data
IBM: (The famous 3-V’s definition)
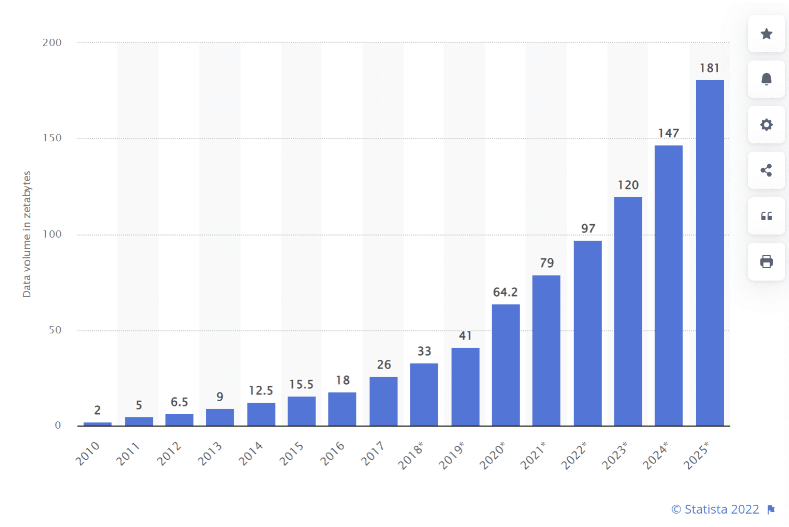
Volume (Gigabytes -> Exabytes -> Zettabytes)
Velocity (Batch -> Streaming -> Real-time AI inference)
Variety (Structured, Semi-structured, Unstructured, Embeddings)
Additional V’s for 2025
- Variability
- Veracity
- Visualization
- Value
- Vectors (embeddings for AI/ML)
- Versatility (multi-modal data)
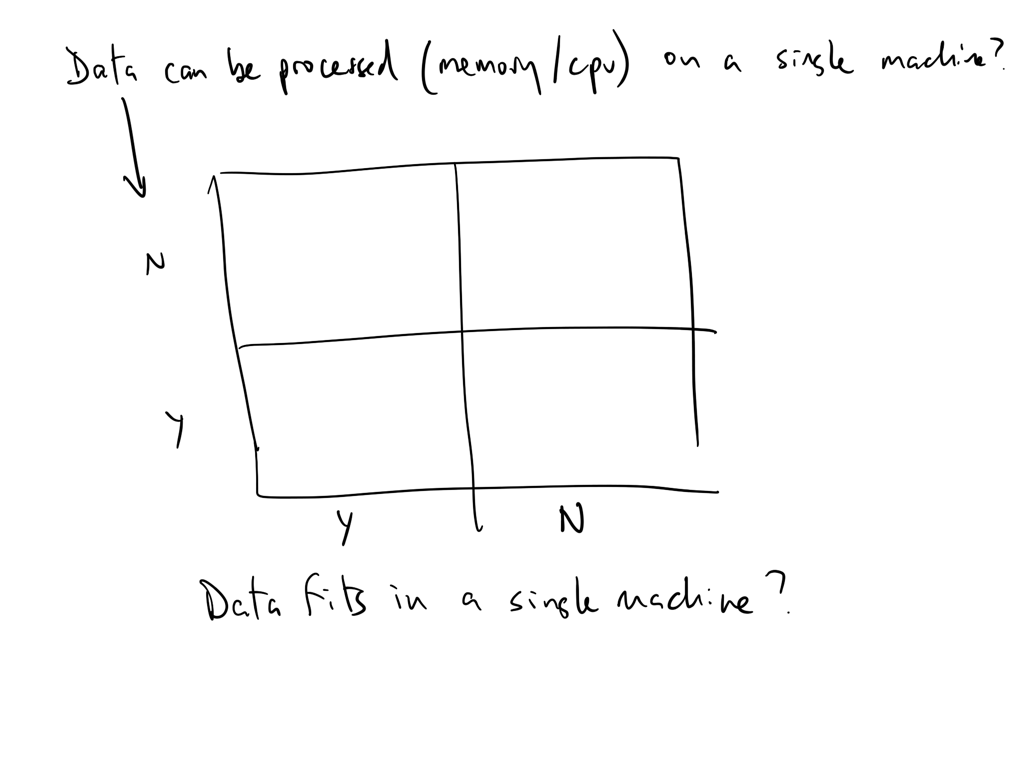
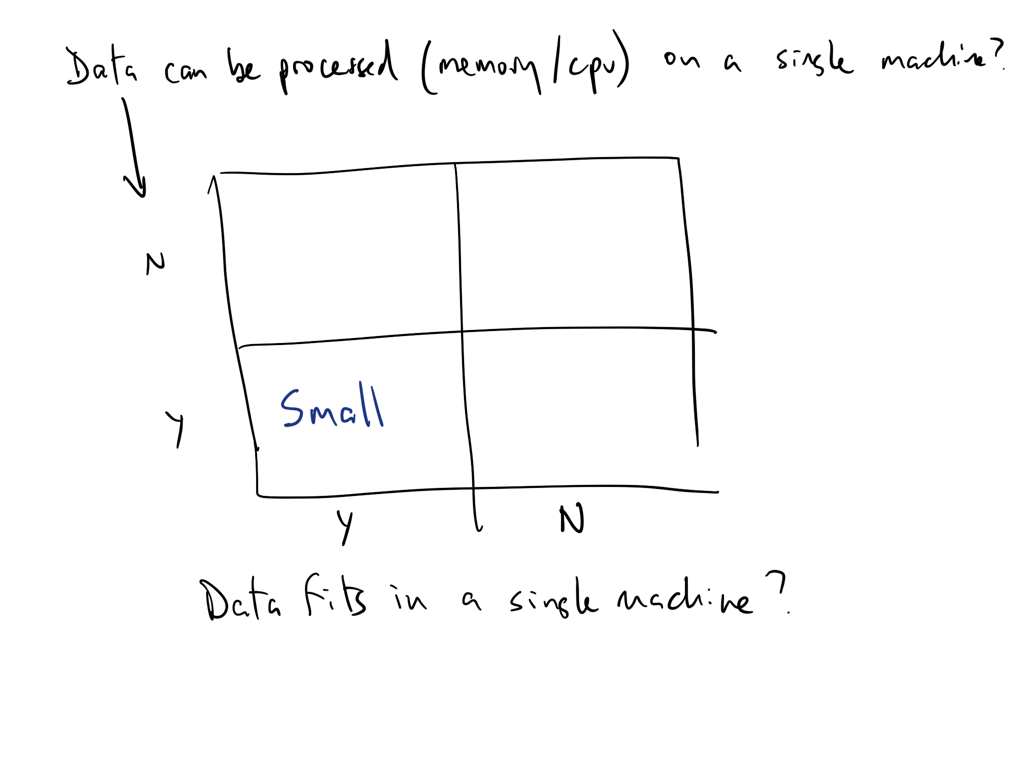
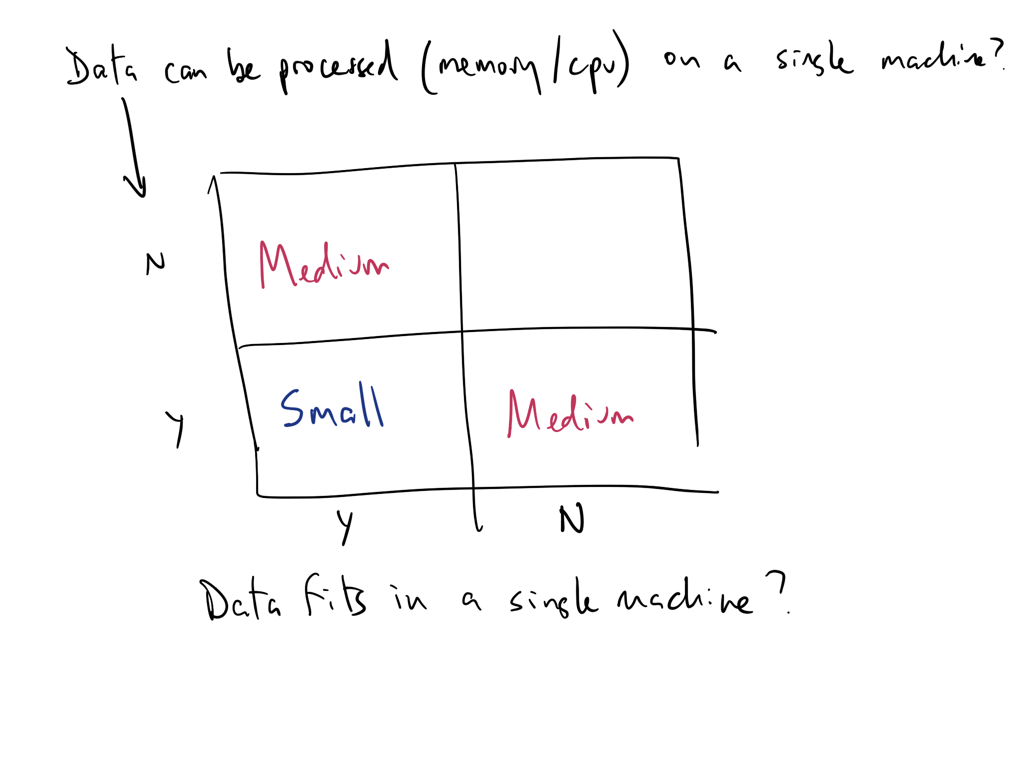
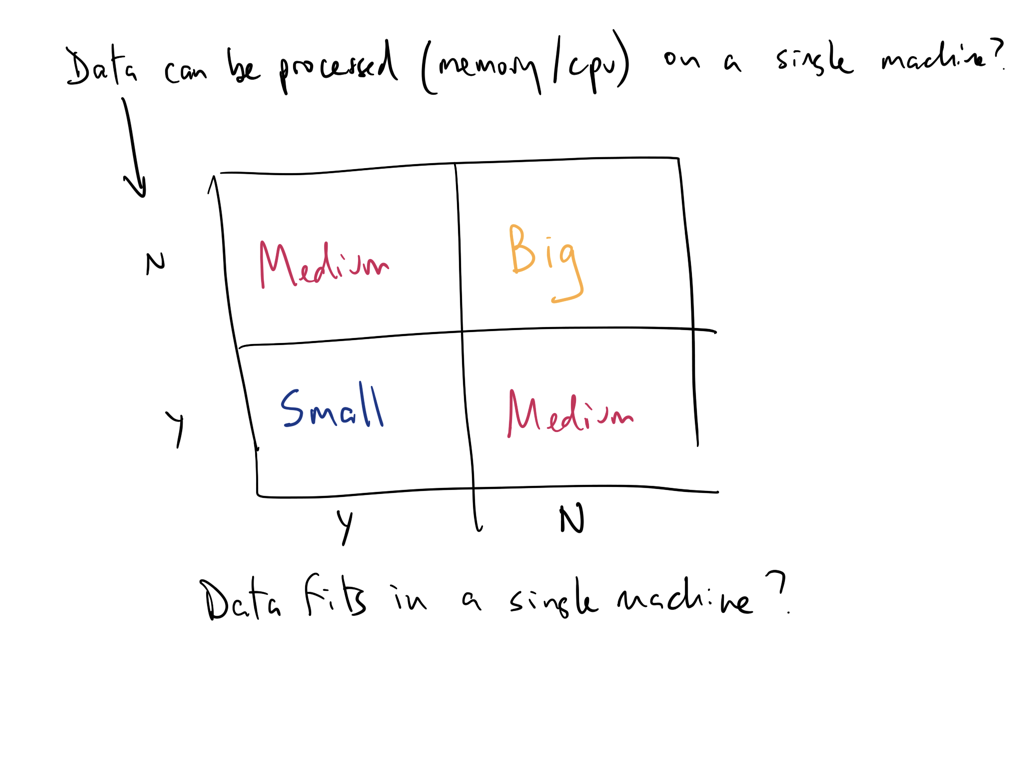
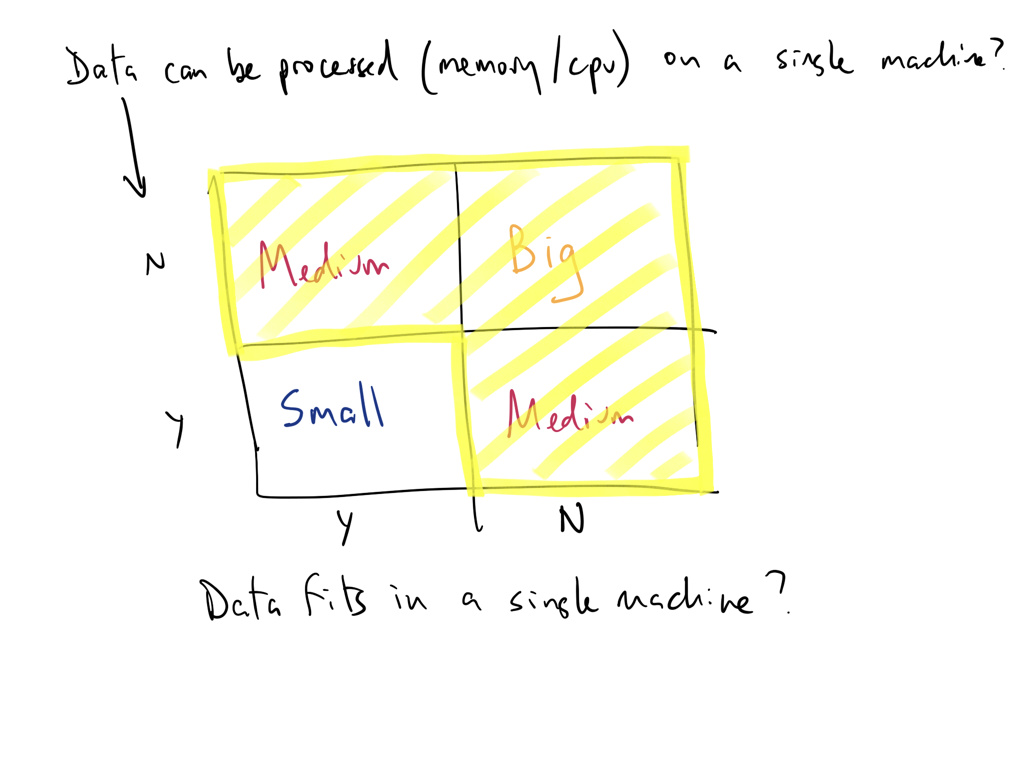
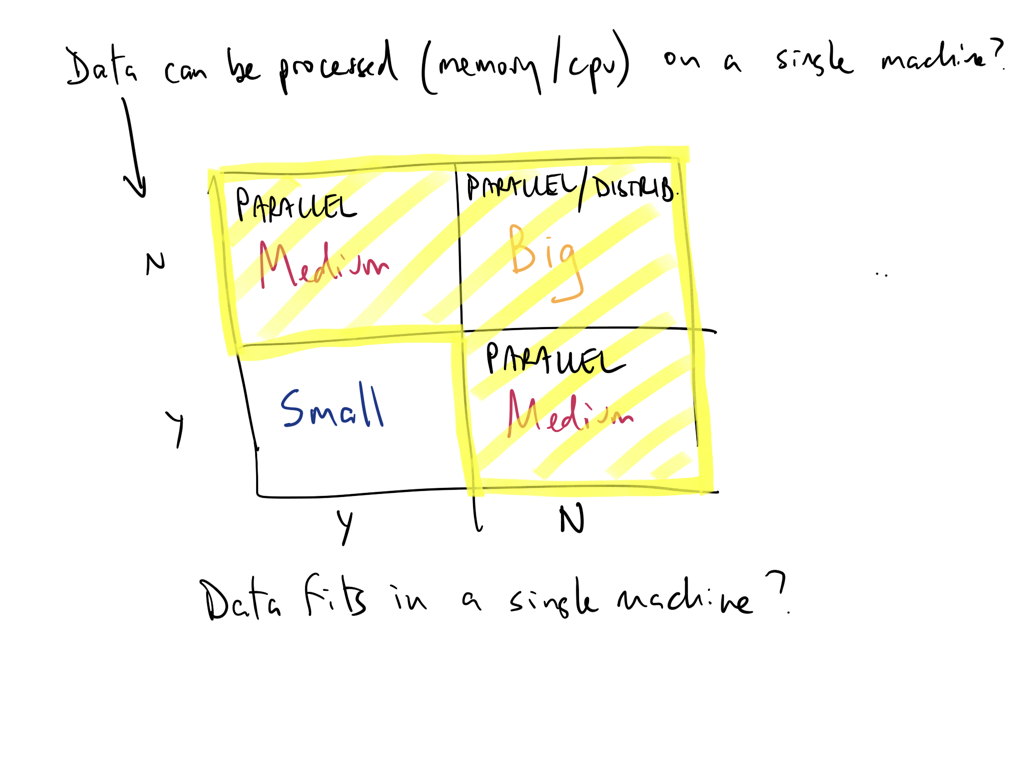
Think of data size as a function of processing and storage
Can you analyze/process your data on a single machine?
Can you store (or is it stored) on a single machine?
Can you serve it fast enough for real-time AI applications?
If any of of the answers is no then you have a big-ish data problem!
Big Data in the Age of Generative AI
The New Data Landscape (2025)
Training Foundation Models
- GPT-4: Trained on ~13 trillion tokens
- Llama 3: 15 trillion tokens
- Google’s Gemini: Multi-modal training on text, images, video
- Each iteration requires petabytes of curated data
Data Requirements Have Exploded
- 2020: BERT trained on 3.3 billion words
- 2023: GPT-4 trained on ~13 trillion tokens
- 2024: Llama 3 trained on 15+ trillion tokens
- Future: Approaching the limits of human-generated text
Big Data Infrastructure for AI
Data Lakes & Warehouses for AI
Traditional Use Cases: * Business intelligence * Analytics & reporting * Historical data storage
Modern AI Use Cases: * Training data repositories * Vector embeddings storage * RAG (Retrieval-Augmented Generation) context * Fine-tuning datasets * Evaluation & benchmark data
RAG & Context Engineering
The New Data Pipeline
Raw Data → Data Lake → Processing → Vector DB → LLM ContextKey Components: * Data Lakes (S3, Azure Data Lake): Store massive unstructured data * Data Warehouses (Snowflake, BigQuery): Structured data for context * Vector Databases (Pinecone, Weaviate, Qdrant): Semantic search * Embedding Models: Convert data to vectors * Orchestration (Airflow, Prefect): Manage the pipeline
MCP Servers & Agentic AI
Model Context Protocol (MCP)
What is MCP? * Open protocol for connecting AI assistants to data sources * Standardized way to expose tools and data to LLMs * Enables “agentic” behavior - AI that can act autonomously
MCP in Production
Data Warehouse → MCP Server → AI Agent → ActionExamples: * AI agents querying Snowflake for real-time analytics * Autonomous systems updating data lakes based on predictions * Multi-agent systems coordinating through shared data contexts
Data Quality for AI
Why Data Quality Matters More Than Ever
Garbage In, Garbage Out - Amplified: * Bad training data → Biased models * Incorrect RAG data → Hallucinations * Poor data governance → Compliance issues
Data Quality Challenges in 2025
- Scale: Validating trillions of tokens
- Diversity: Multi-modal, multi-lingual data
- Velocity: Real-time data for online learning
- Veracity: Detecting AI-generated synthetic data
Real-World Big Data + AI Examples
Netflix
- Data Scale: 260+ million subscribers generating 100+ billion events/day
- AI Use: Personalization, content recommendations, thumbnail generation
- Stack: S3 → Spark → Iceberg → ML models → Real-time serving
Uber
- Data Scale: 35+ million trips per day, petabytes of location data
- AI Use: ETA prediction, surge pricing, driver-rider matching
- Stack: Kafka → Spark Streaming → Feature Store → ML Platform
OpenAI
- Data Scale: Trillions of tokens for training, millions of queries/day
- AI Use: GPT models, DALL-E, embeddings
- Stack: Distributed training → Vector DBs → Inference clusters
The Future: Big Data + AI Convergence
Emerging Trends (2025-2027)
Unified Platforms: * Data lakes becoming “AI lakes” * Integrated vector + relational databases * One-stop shops for data + AI (Databricks, Snowflake Cortex)
Edge Computing + AI: * Processing at the data source * Federated learning across devices * 5G enabling real-time edge AI
Synthetic Data: * AI generating training data for AI * Privacy-preserving synthetic datasets * Infinite data generation loops
Relative data sizes
Relative data sizes
Relative data sizes
Relative data sizes
Relative data sizes
Relative data sizes
What You’ll Learn in This Course
Big Data-driven Analytics
Query Engines: * DuckDB - In-process analytical database * Polars - Lightning-fast DataFrame library
* Spark - Distributed processing at scale
Data Warehouses & Lakes: * Snowflake - Cloud-native data warehouse * Athena - Serverless SQL on S3
Orchestration: * Serverless with AWS Lambda * Airflow for pipeline management (?)
Data Types
- Structured
- Unstructured
- Natural language
- Machine-generated
- Graph-based
- Audio, video, and images
- Streaming
Big Data vs. Small Data
| Small Data is usually… | On the other hand, Big Data… | |
|---|---|---|
| Goals | gathered for a specific goal | may have a goal in mind when it’s first started, but things can evolve or take unexpected directions |
| Location | in one place, and often in a single computer file | can be in multiple files in multiple servers on computers in different geographic locations |
| Structure/Contents | highly structured like an Excel spreadsheet, and it’s got rows and columns of data | can be unstructured, it can have many formats in files involved across disciplines, and may link to other resources |
| Preparation | prepared by the end user for their own purposes | is often prepared by one group of people, analyzed by a second group of people, and then used by a third group of people, and they may have different purposes, and they may have different disciplines |
Big Data vs. Small Data
| Small Data is usually… | On the other hand, Big Data… | |
|---|---|---|
| Longevity | kept for a specific amount of time after the project is over because there’s a clear ending point. In the academic world it’s maybe five or seven years and then you can throw it away | contains data that must be stored in perpetuity. Many big data projects extend into the past and future |
| Measurements | measured with a single protocol using set units and it’s usually done at the same time | is collected and measured using many sources, protocols, units, etc |
| Reproducibility | be reproduced in their entirety if something goes wrong in the process | replication is seldom feasible |
| Stakes | if things go wrong the costs are limited, it’s not an enormous problem | can have high costs of failure in terms of money, time and labor |
| Access | identified by a location specified in a row/column | unless it is exceptionally well designed, the organization can be inscrutable |
| Analysis | analyzed together, all at once | is ordinarily analyzed in incremental steps |
Challenges of working with very large datasets
| V | Challenge |
|---|---|
| Volume | data scale |
| Value | data usefulness in decision making |
| Velocity | data processing: batch or stream |
| Viscosity | data complexity |
| Variability | data flow inconsistency |
| Volatility | data durability |
| Viability | data activeness |
| Validity | data properly understandable |
| Variety | data heterogeneity |
Thinking about big data workflows
William Cohen (Director, Research Engineering, Google) said the following:
Working with big data is not about:
- Code optimization
- Learning the details of today’s hardware/software (they are evolving…)
Working with big data is about understanding:
- The cost of what you want to do
- What the tools that are available offer
- How much can be accomplished with linear or nearly-linear operations
- How to organize your computations so that they effectively use whatever’s fast
- How to test/debug/verify with large data
Traditional data analysis tools like R and Python are single threaded
Tools at-a-glance
Languages, libraries, and projects
We’ll talk briefly about Apache Hadoop today but we will not cover it in this course.
Cloud Services
- Amazon Web Services (AWS)
- Azure
Other:
Additional links of interest
Matt Turck’s Machine Learning, Artificial Intelligence & Data Landscape (MAD)
Data Engineering
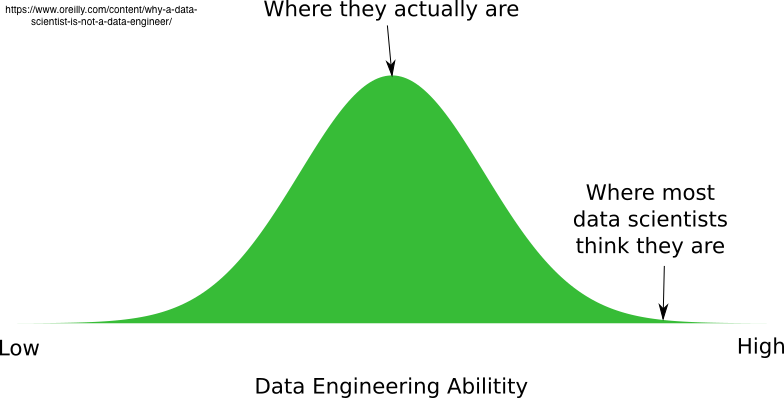
Difference between Data Scientist and Data Engineer
In this course, you’ll be doing a little data engineering!

Responsibilities
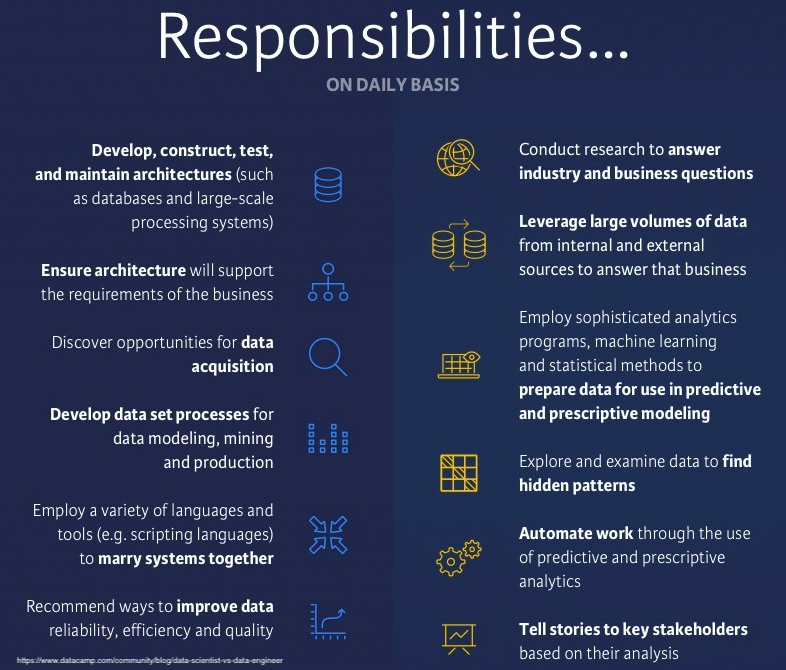
Data Engineering falls into levels 2 and 3 primarily
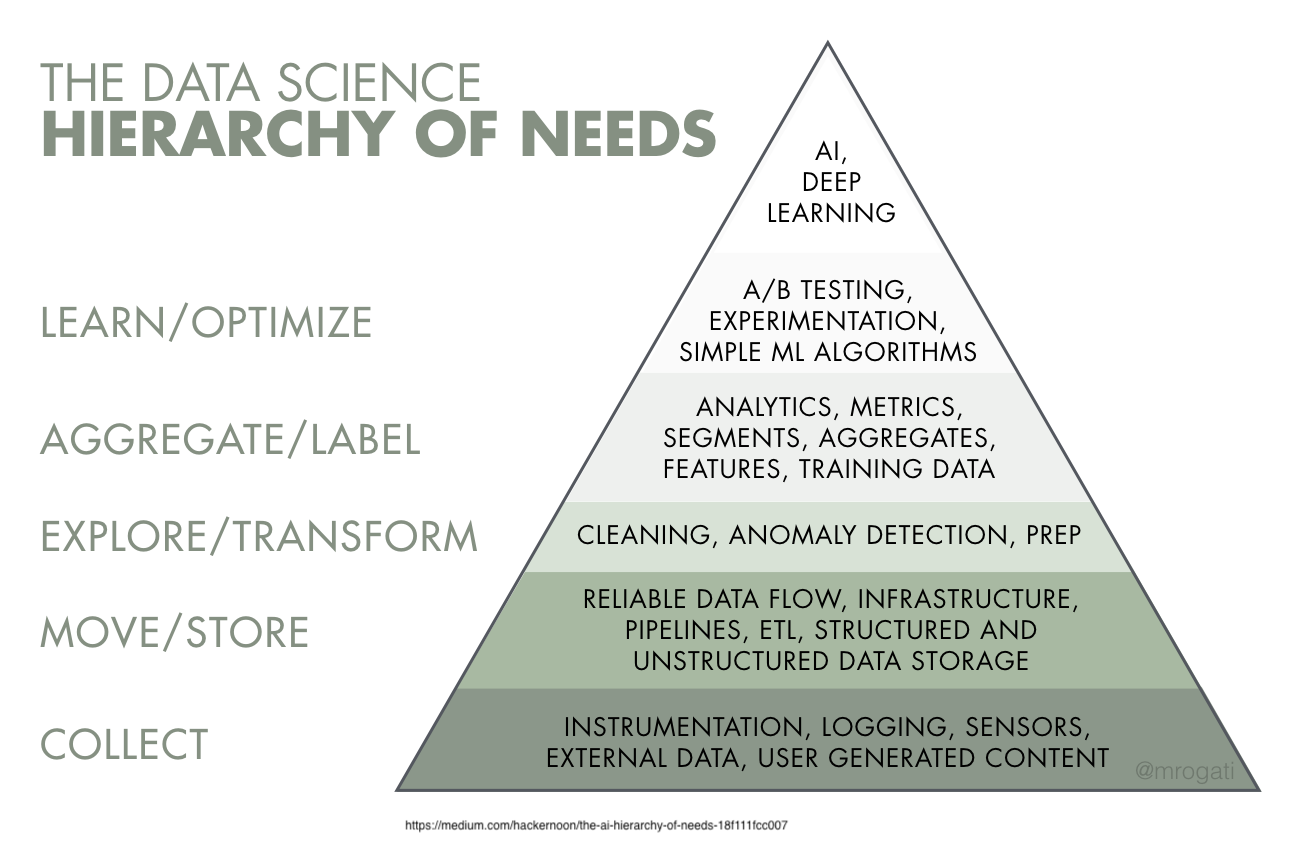
As an analyst/data scientist, you really need both
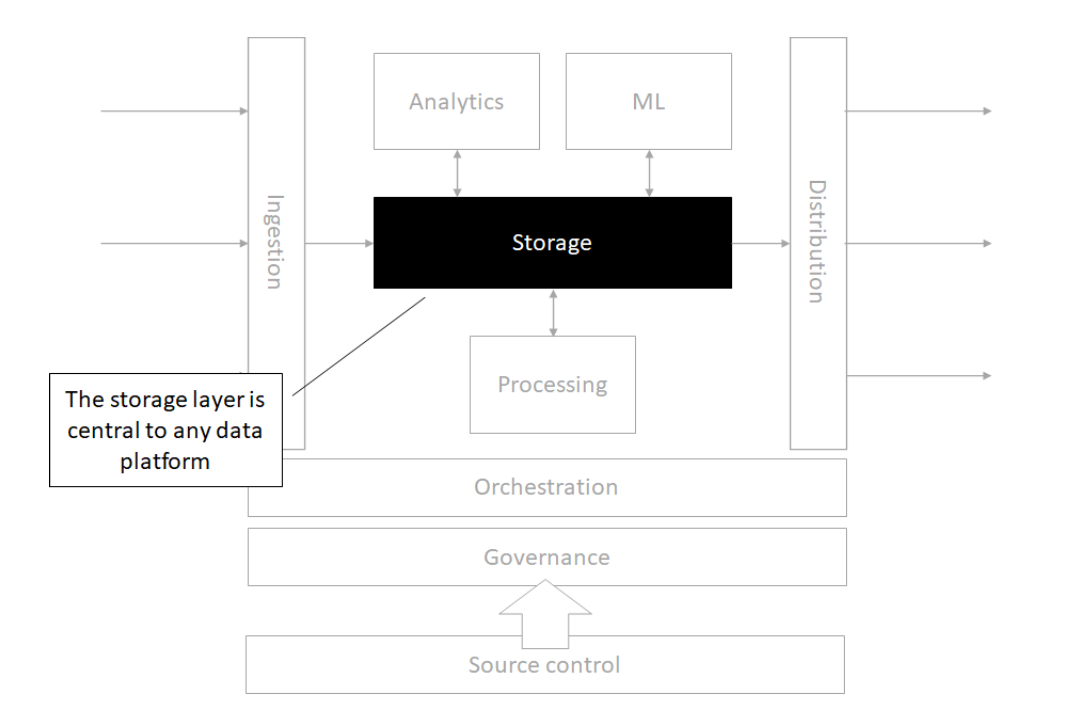
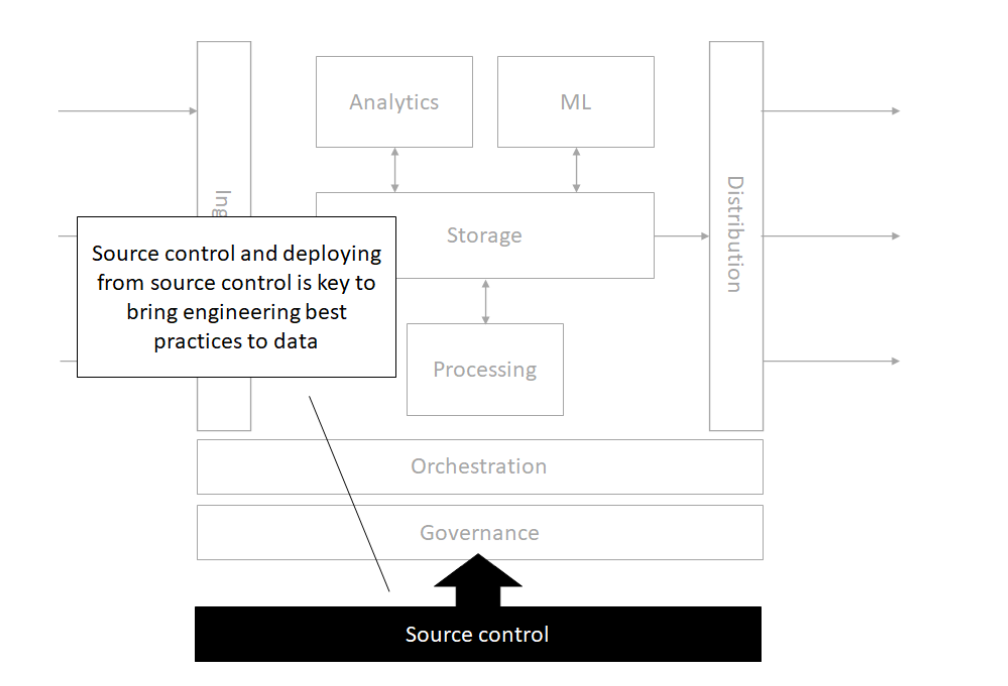
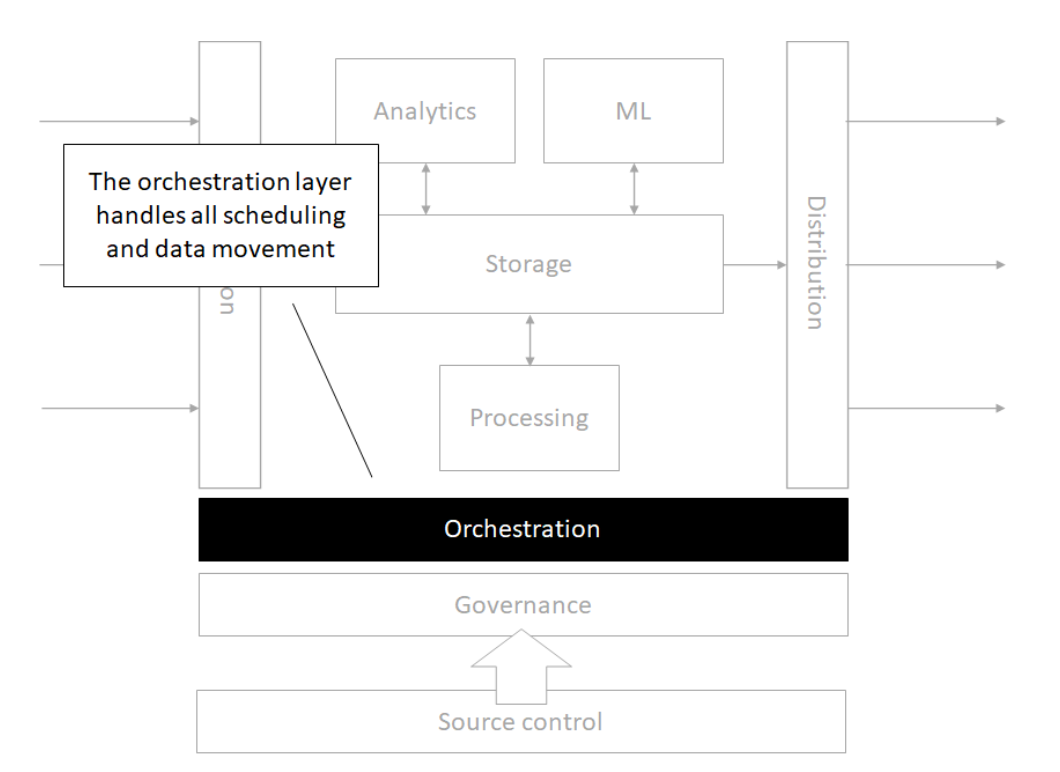
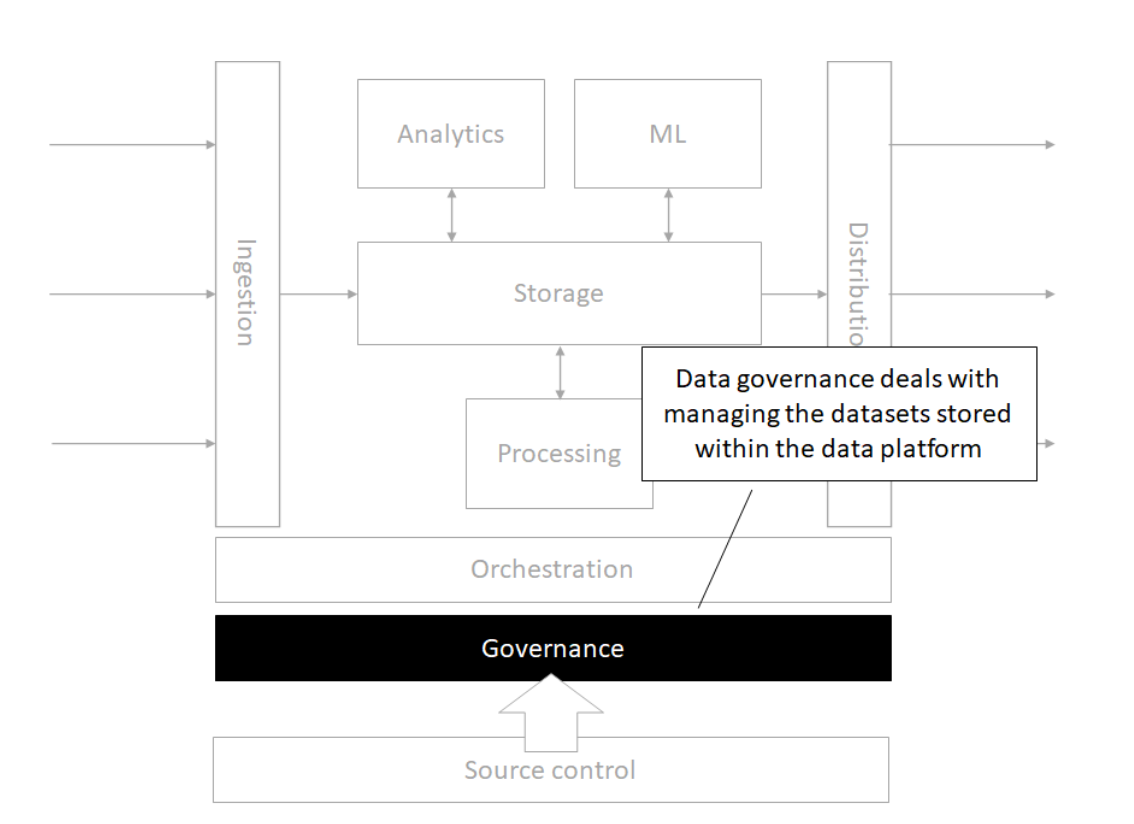
The modern data architecture
Architecture
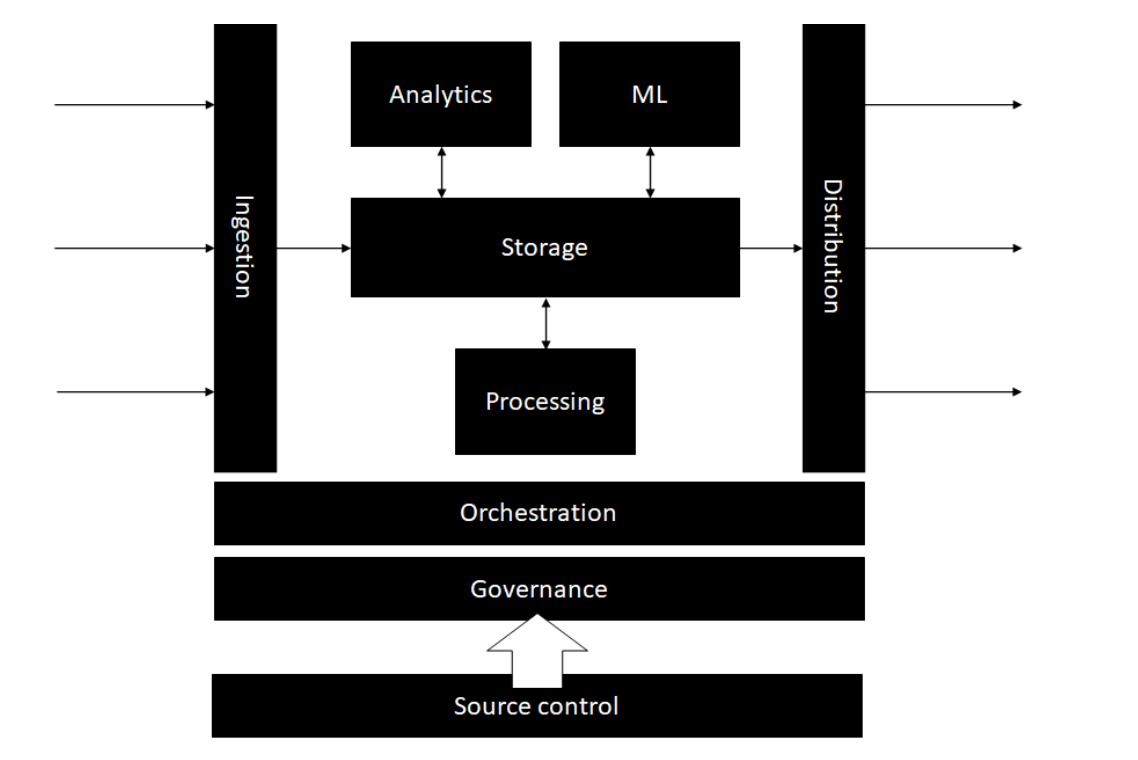
Storage
Source control
Orchestration
Processing
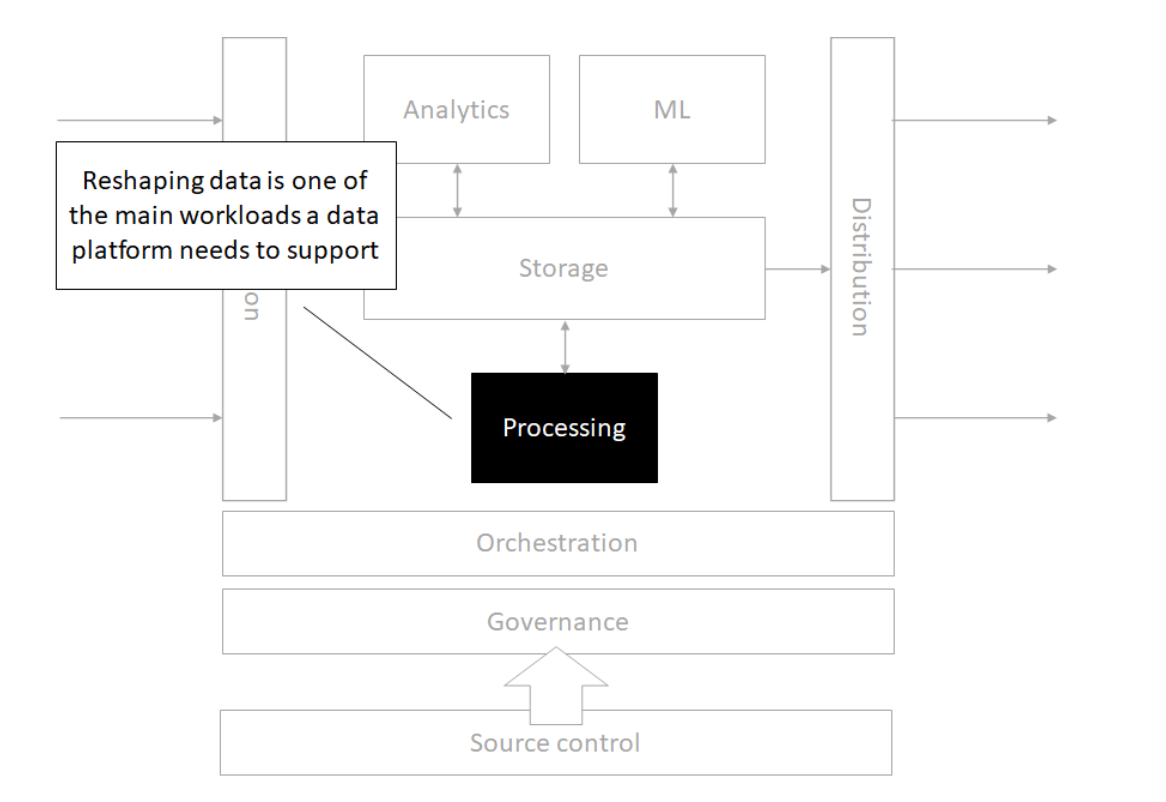
Analytics
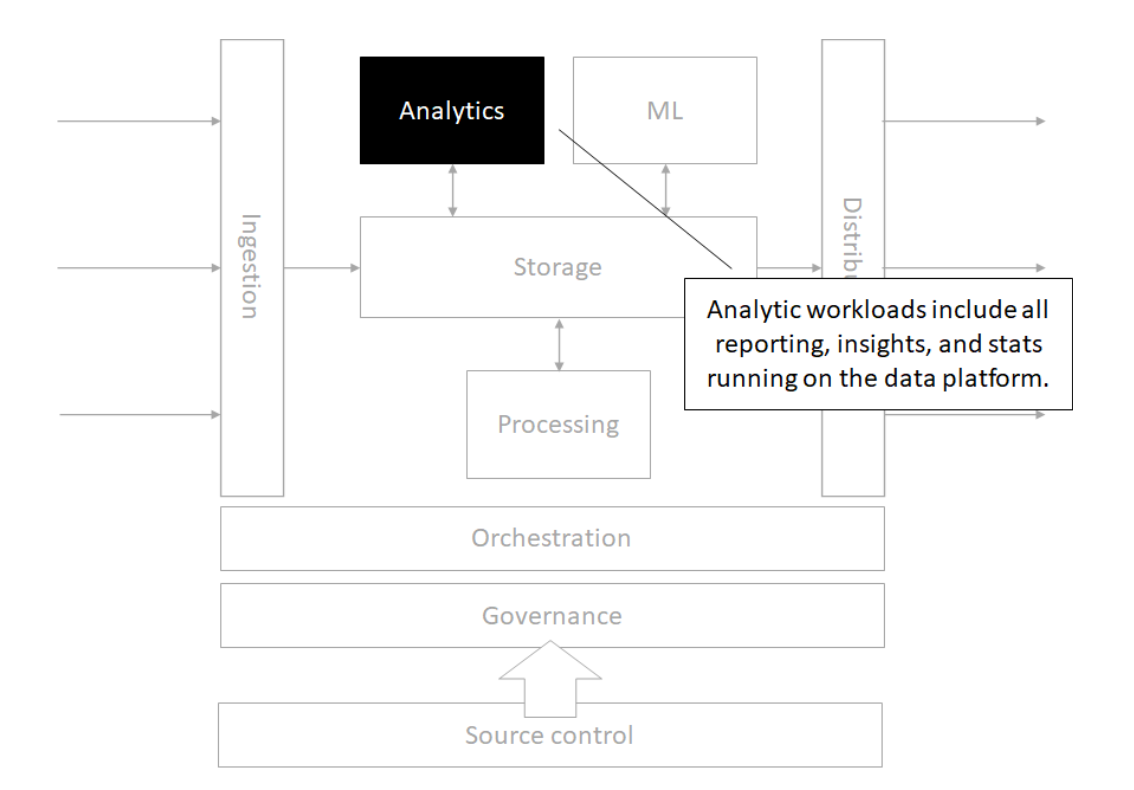
Machine Learning
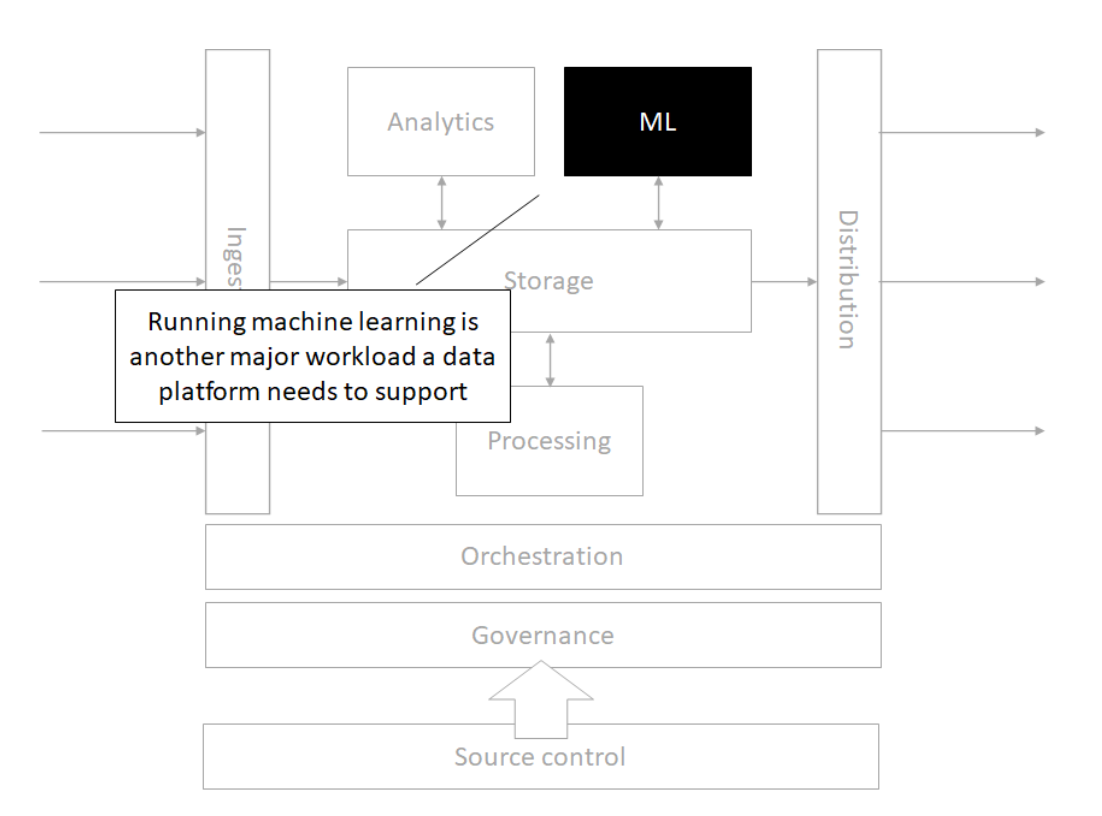
Governance
Time for Lab!
Linux Command Line
Linux Command Line
Terminal
- Terminal access was THE ONLY way to do programming
- No GUIs! No Spyder, Jupyter, RStudio, etc.
- Coding is still more powerful than graphical interfaces for complex jobs
- Coding makes work repeatable
Linux Command Line
BASH

- Created in 1989 by Brian Fox
- Brian Fox also built the first online interactive banking software
- BASH is a command processor
- Connection between you and the machine language and hardware
Linux Command Line
The Prompt
username@hostname:current_directory $
What do we learn from the prompt?
- Who you are - username
- The machine where your code is running - hostname
- The directory where your code is running - current_directory
- The shell type - $ - this symbol means BASH
Linux Command Line
Syntax
COMMAND -F --FLAG * COMMAND is the program * Everything after that are arguments * F is a single letter flag * FLAG is a single word or words connected by dashes flag. A space breaks things into a new argument. + Sometimes single letter and long form flags (e.g. F and FLAG) can refer to the same argument
COMMAND -F --FILE file1
Here we pass an text argument “file1” into the FILE flag
The -h flag is usually to get help. You can also run the man command and pass the name of the program as the argument to get the help page.
Let’s try basic commands:
dateto get the current datewhoamito get your user nameecho "Hello World"to print to the console
Linux Command Line
Examining Files
Find out your Present Working Directory pwd
Examine the contents of files and folders using the ls command
Make new files from scratch using the touch command
Globbing - how to select files in a general way
\*for wild card any number of characters\?for wild card for a single character[]for one of many character options!for exclusion- special options
[:alpha:],[:alnum:],[:digit:],[:lower:],[:upper:]
Linux Command Line
Navigating Directories
Knowing where your terminal is executing code ensures you are working with the right inputs and making the right outputs.
Use the command pwd to determine the Present Working Directory.
Let’s say you need to change to a folder called “git-repo”. To change directories you can use a command like cd git-repo.
.refers to the current directory, such as./git-repo..can be used to move up one folder, usecd .., and can be combined to move up multiple levels../../my_folder/is the root of the Linux OS, where there are core folders, such as system, users, etc.~is the home directory. Move to folders referenced relative to this path by including it at the start of your path, for example~/projects.
To view the structure of directories from your present working directory, use the tree command
Linux Command Line
Interacting with Files
Now that we know how to navigate through directories, we need to learn the commands for interacting with files
mvto move files from one location to another- Can use file globbing here - ?, *, [], …
cpto copy files instead of moving- Can use file globbing here - ?, *, [], …
mkdirto make a directoryrmto remove filesrmdirto remove directoriesrm -rfto blast everything! WARNING!!! DO NOT USE UNLESS YOU KNOW WHAT YOU ARE DOING
Linux Command Line
Using BASH for Data Exploration
Commands:
head FILENAME/tail FILENAME- glimpsing the first / last few rows of datamore FILENAME/less FILENAME- viewing the data with basic up / (up & down) controlscat FILENAME- print entire file contents into terminalvim FILENAME- open (or edit!) the file in vim editorgrep FILENAME- search for lines within a file that match a regex expressionwc FILENAME- count the number of lines (-lflag) or number of words (-wflag)
Linux Command Line
Pipes and Arrows
|sends the stdout to another command (is the most powerful symbol in BASH!)>sends stdout to a file and overwrites anything that was there before>>appends the stdout to the end of a file (or starts a new file from scratch if one does not exist yet)<sends stdin into the command on the left
To-dos:
echo Hello World- Counting rows of data with certain attributes
Linux Command Line
Alias and User Files
.bashrc is where your shell settings are located
If we wanted a shortcut to find out the number of our running processes, we would write a commmand like whoami | xargs ps -u | wc -l.
We don’t want to write out this full command every time! Let’s make an alias.
alias alias_name="command_to_run"
alias nproc="whoami | xargs ps -u | wc -l"
Now we need to put this alias into the .bashrc
alias nproc="whoami | xargs ps -u | wc -l" >> ~/.bashrc
What happened??
echo alias nproc="whoami | xargs ps -u | wc -l" >> ~/.bashrc
Your commands get saved in ~/.bash_history
Linux Command Line
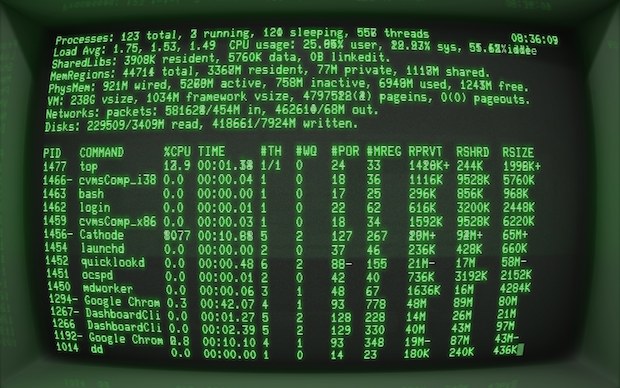
Process Managment
Use the command ps to see your running processes.
Use the command top or even better htop to see all the running processes on the machine.
Install the program htop using the command sudo yum install htop -y
Find the process ID (PID) so you can kill a broken process.
Use the command kill [PID NUM] to signal the process to terminate. If things get really bad, then use the command kill -9 [PID NUM]
To kill a command in the terminal window it is running in, try using Ctrl + C or Ctrl + /
Run the cat command on its own to let it stay open. Now open a new terminal to examine the processes and find the cat process.
Reference material: Text Lesson 1,2,3,7,9,10
Try playing a Linux game!
https://gitlab.com/slackermedia/bashcrawl is a game to help you practice your navigation and file access skills. Click on the binder link in this repo to launch a jupyter lab session and explore!